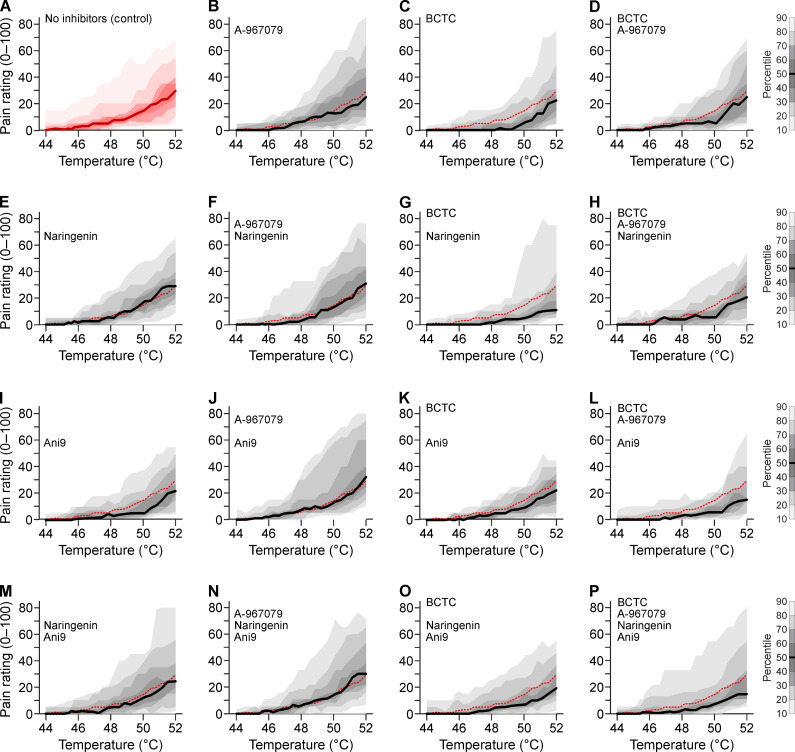
Fig. 2. Heat-induced pain ratings in response to pharmacological inhibition of TRPV1, TRPA1, TRPM3, and ANO1.
Each panel shows the distribution of pain ratings in the range of 44° to 52°C in visit 2 obtained from 24 participants. (A) Pain ratings without antagonists. (B to P) TRPA1 inhibitor A-967079 (10 μM) is present in panels of columns 2 and 4 and can be compared to the panels to the left of it. TRPV1 inhibitor BCTC (1 μM) is present in columns 3 and 4. Similarly, the TRPM3 inhibitor naringenin (20 μM) is present in rows 2 and 4 and can be compared to the panels above it. The ANO1 inhibitor Ani9 (10 μM) is present in rows 3 and 4. The red dashed line is the median of the control experiment shown in (A). The experimental design derives statistical efficiency from four measurements with and without every antagonist in every participant. Direct statistical pairwise comparisons of panels were formally not justified based on the prespecified design and due to the nonsignificant interaction terms.

