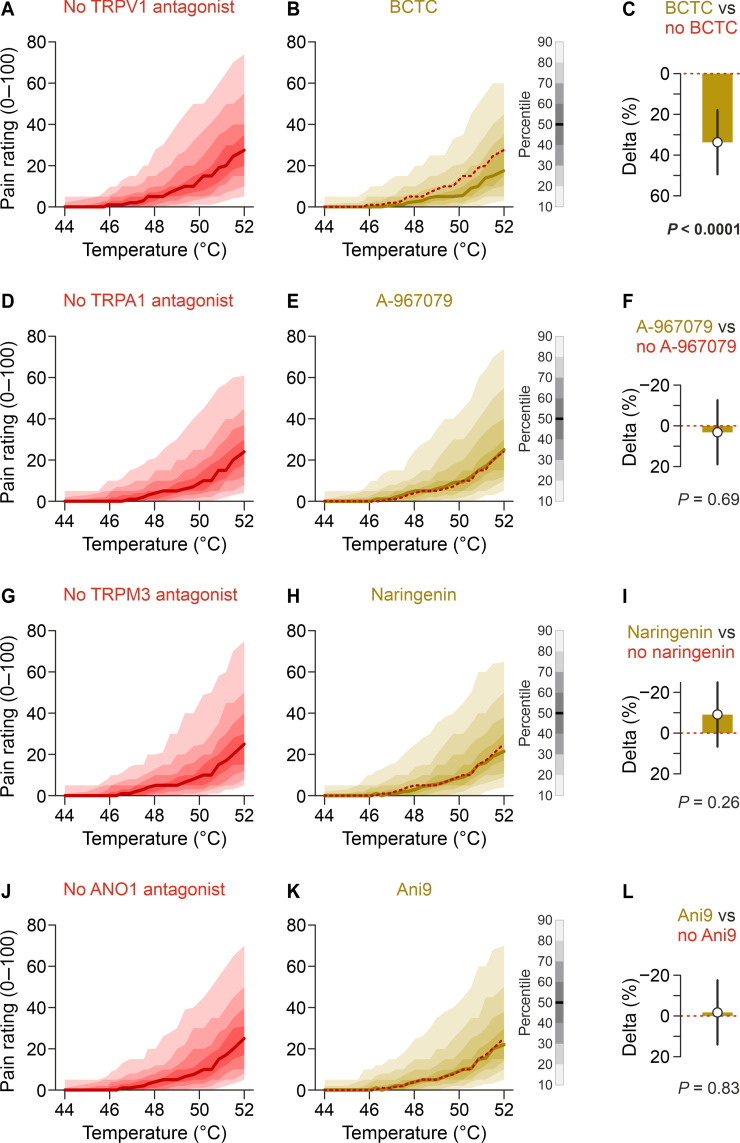
Fig. 3. Heat pain is reduced by inhibition of TRPV1 but not TRPA1, TRPM3, and ANO1.
Each panel shows the distribution of pain ratings plotted against the temperature. Data are from visit 2 and all 48 participants. The left column shows injections without the respective antagonist but with or without the other antagonists. The middle column consists of all injections including the respective antagonist. (A) Pain ratings of all heated injections without and (B) with 1 μM BCTC. The red dashed lines indicate the median of all injections without the respective substance. (C) HPI due to BCTC over the whole time course (contrast estimate with 95% CI). (D) Pain ratings of all injections without and (E) with 10 μM A-967079, resulting in (F) no relevant HPI. (G) Pain ratings of all injections without and (H) with 20 μM naringenin, resulting in (I) no relevant HPI. (J) Pain ratings of all injections without and (K) with 10 μM Ani9, resulting in (L) no relevant HPI.

