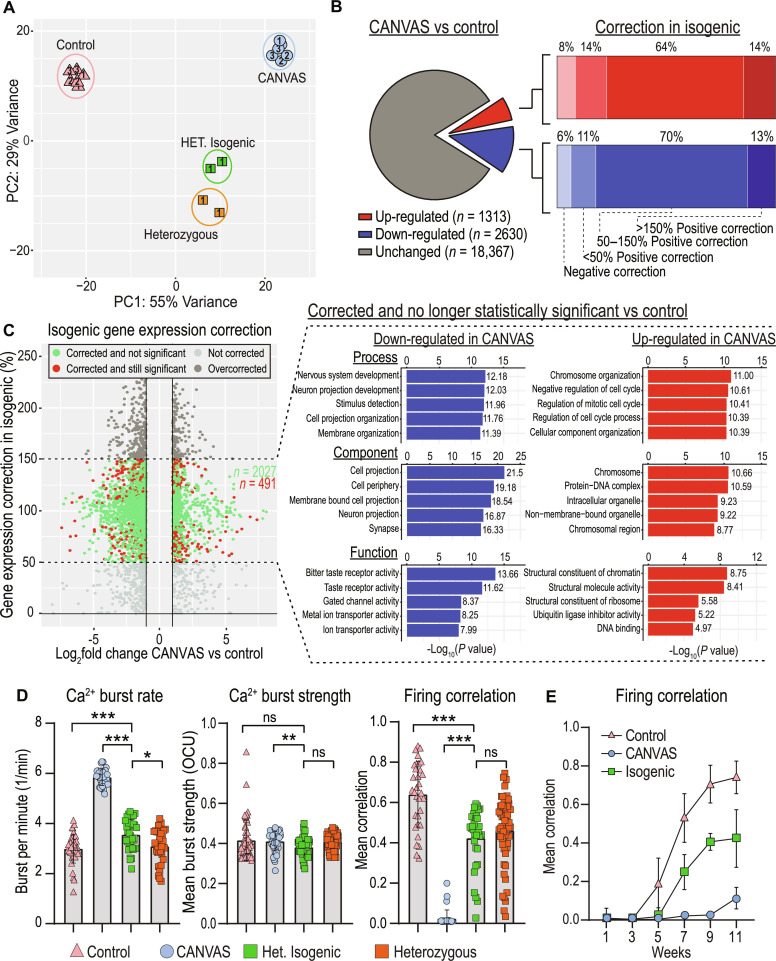
Fig. 6. Heterozygous isogenic correction of CANVAS neurons corrects transcriptomic and synaptic functional deficits.
(A) PCA of CANVAS (n = 3), control (n = 3), heterozygous (n = 1), and CANVAS heterozygous isogenic (n = 1) patient iPSC–derived neurons. Patient number indicated within shapes identify technical replicates. (B) Schematic illustrating the total number of genes dysregulated (up and down) in CANVAS versus control (left), with the percentage of these up- or down-dysregulated genes that show negative correction, partial correction, or full correction of expression upon heterozygous isogenic correction of CANVAS patient iPSC–derived neuron line. (C) Scatter plot of Log2FoldChange (CANVAS versus control) versus gene expression correction per gene in the heterozygous isogenic patient iPSC–derived neurons (left), and GO pathway analysis of the top five up-/down-regulated biological process, cellular component, and molecular function for the genes that show 50 to 150% gene expression in isogenic correction versus CANVAS and are nonstatistically significant in isogenic versus control conditions. (D) Analysis of Ca2+ imaging metrics for control (n = 3), CANVAS (n = 3), heterozygous (n = 1), and heterozygous isogenic (n = 1) patient iPSC–derived neurons. Burst rate (F2,165 = 279.4, P < 0.0001), burst strength (F2,165 = 4.034, P = 0.019), and firing correlation (F2,165 = 185.9, P < 0.0001). Each data point represents the mean of ~1000 to 3000 active cells per well (fig. S8). Data were analyzed by one-way ANOVA with Sidak’s post hoc multiple comparison tests. (E) Mean firing correlation of control (n = 3), CANVAS (n = 3), and heterozygous isogenic (n = 1) patient iPSC–derived neurons across 10 weeks of differentiation from week 1 to week 11. Error = SD.

