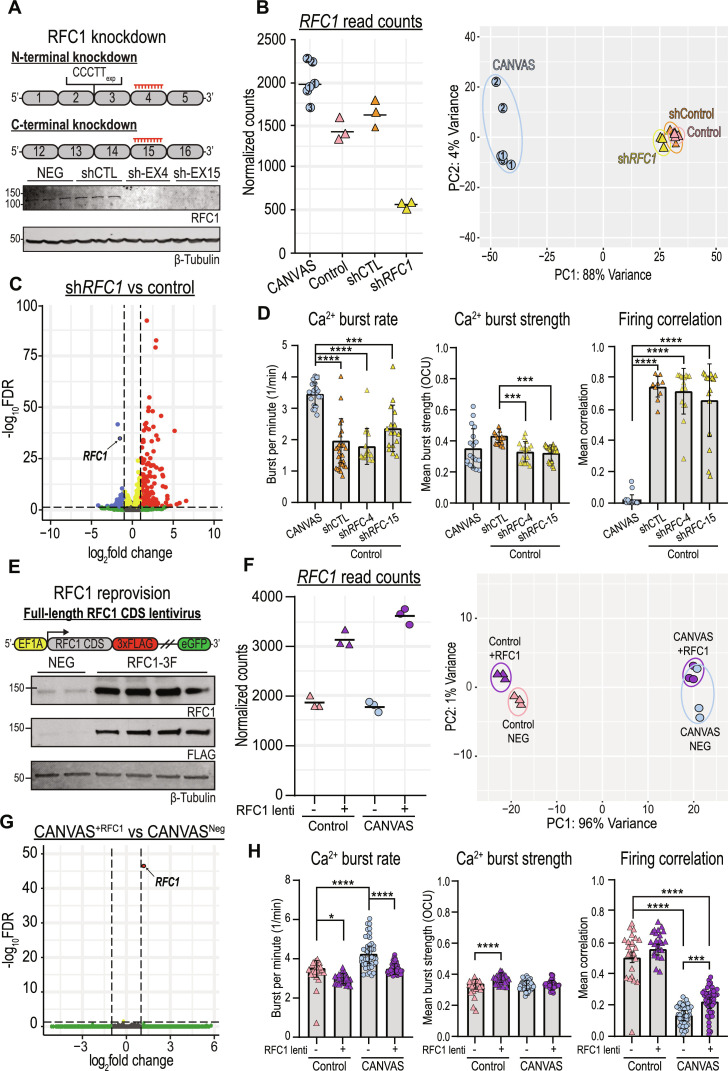
Fig. 7. Altering RFC1 expression neither recapitulates nor corrects CANVAS patient neuron dysfunction.
(A) Schematic of RFC1 knockdown using RFC1 N or C terminus targeting shRNA lentiviruses (top) and RFC1 expression after knockdown in control iPSC–derived neurons (bottom). (B) Normalized read counts for RFC1 transcripts (left) and PCA (right) in CANVAS (n = 3), control (n = 3), control mock-treated (n = 3), and control shRFC1-treated (n = 3) patient iPSC–derived neurons. (C) Volcano plot of RFC1 knockdown versus control, RFC1 labeled. (D) Ca2+ imaging metrics of CANVAS (n = 3) and control (n = 3) patient iPSC–derived neurons treated with shControl or shRFC1 lentiviruses. Burst rate (F3,78 = 29.6, P < 0.0001), burst strength (F3,78 = 8.265, P < 0.0001), and firing correlation (F3,78 = 100.6, P < 0.0001). (E) Schematic of RFC1 overexpression in CANVAS patient iPSC–derived neurons (top) and analysis of RFC1 expression in patient iPSC–derived neurons upon lentiviral transduction (bottom). (F) Normalized read counts for RFC1 transcripts (left) and PCA of CANVAS and control iPSC–derived neurons transduced either full-length RFC1 CDS or control lentivirus (n = 3 per group) (right). (G) Volcano plot of CANVAS patient–derived neurons transduced with either full-length RFC1 CDS or control lentivirus (n = 3 per group), RFC1 labeled. (H) Ca2+ imaging metrics of control (n = 3) and CANVAS (n = 3) patient iPSC–derived neurons treated with control or RFC1-overexpression lentivirus. Burst rate (F3,135 = 31.01, P < 0.0001), burst strength (F3,135 = 16.74, P < 0.0001), and firing correlation (F3,135 = 147.3, P < 0.0001). Firing correlation two-way ANOVA treatment versus genotype: F1,135 = 41.25, P < 0.0001 and F1,135 = 36.64, P < 0.0001, respectively. Each data point represents the mean of ~1000 to 3000 active cells per well (fig. S5). Data were analyzed by one-way ANOVA with Sidak’s post hoc multiple comparison tests. Patient numbers indicated identify technical replicates. Error = SD.

