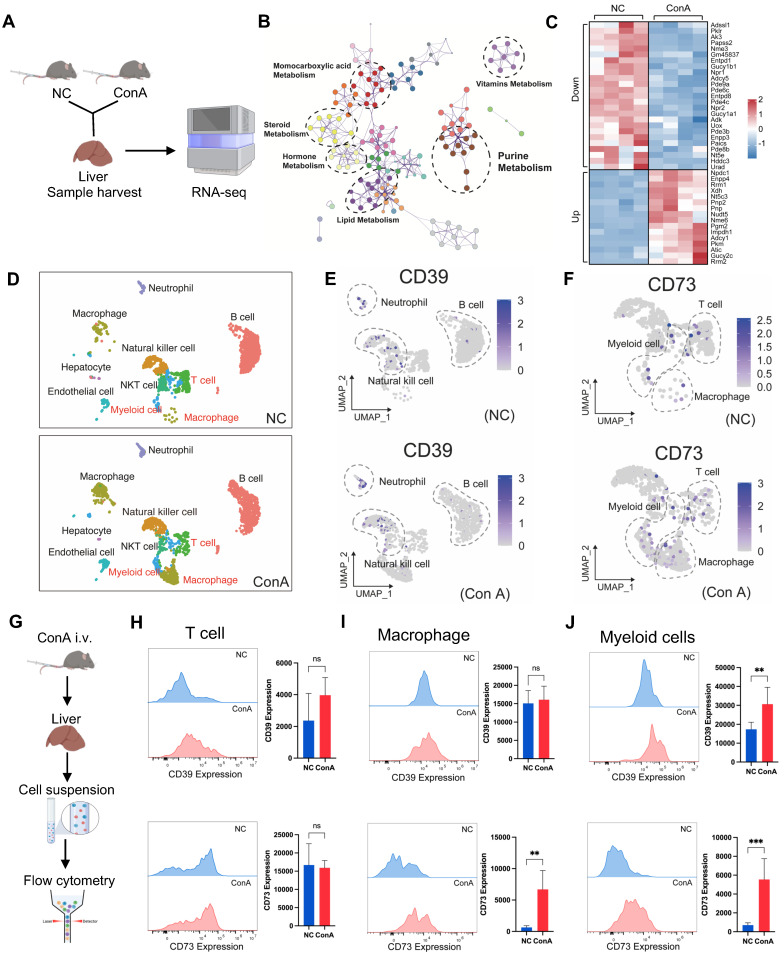
Figure 2.
Upregulation of the CD39-CD73 axis in MCs under T-cell activation-mediated liver injury conditions. (A) Livers from ConA and NC mice were collected for bulk RNA sequencing. (B) Pathway analyses based on the DEGs between the NC and ConA groups. (C) Total differentially expressed genes involved in purine metabolism between the ConA group and the NC group (n = 4 per group). (D) Differences in specific cell clusters between the NC and ConA groups (n = 3 per group). (E-F) The differential expression of CD39 and CD73 in distinct cell clusters between the NC and ConA groups. (G) Validation of CD39 and CD73 expression on immune cells by flow cytometry. (H-J) CD39 and CD73 expression in CD3-positive T cells, CD11b- and F4/80-positive macrophages, and CD11b- and Gr-1-positive MCs between the ConA and NC groups (n = 5 per group).

