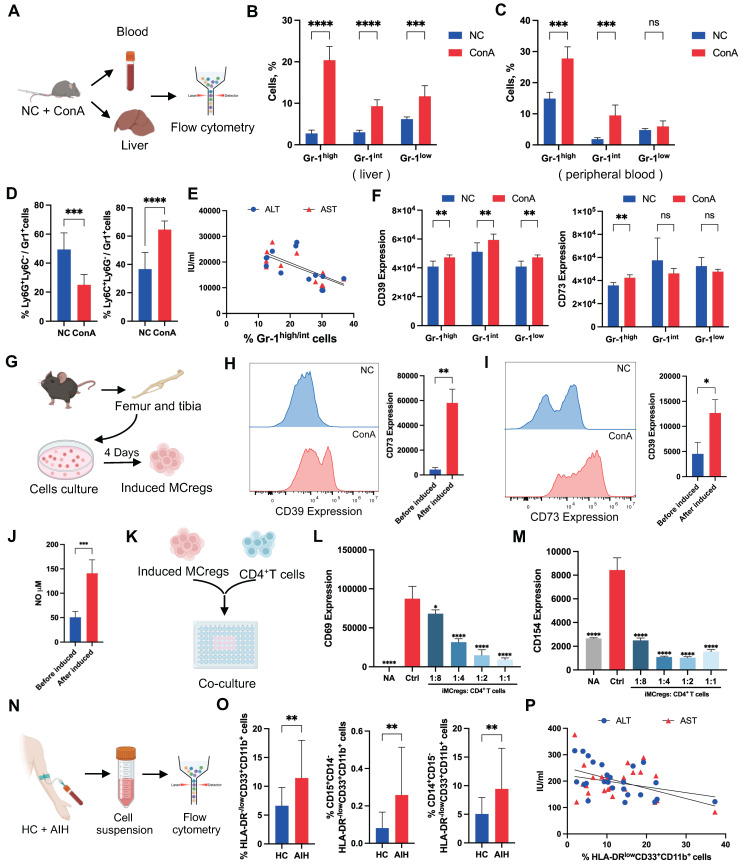
Figure 3.
Natural expansion of a regulatory MC subset in response to liver inflammation. (A) Blood and livers from ConA-induced and NC mice were collected for the detection of MCregs. (B-C) The distribution of CD11b+Gr-1high, Gr-1int, and Gr-1low cells in the liver and blood (n = 5-7). (D) Proportion of Ly6C+ mononuclear lineage and Ly6G+ granular lineage cells within the CD11b+Gr-1high/int cell population in the liver (n = 5-7). (E) Correlation analysis revealed a negative correlation between the percentage of CD11b+Gr-1high/int cells and aminotransferase levels (ALT and AST). (F) Expression levels of CD39 and CD73 in CD11b+Gr-1high, Gr-1int, and Gr-1low cells. (G) The process of MCreg isolation and induction (n = 5-7). (H-I) Changes in CD39 and CD73 expression on MCs before and after induction. (J) The release of NO in MCs before and after induction. (K) The induced MCregs were cocultured with CD4+ T cells at 1:8, 1:4, 1:2, and 1:1 ratios. (L-M) Changes in the expression of CD69 and CD154, which are indicative of T-cell activation, on CD4+ T cells after coculture with induced MCregs at various ratios. (N) Blood from HCs and AIH patients was collected for the evaluation of human MCregs. (O) Percentage of HLA-DR-/lowCD33+CD11b+ cells in peripheral blood, along with the distribution of the CD14+ mononuclear lineage and CD15+ granulocytic lineage within these cells. (P) Correlation analysis between the percentage of HLA-DR-/lowCD33+CD11b+ cells and clinical indicators (ALT and AST).

