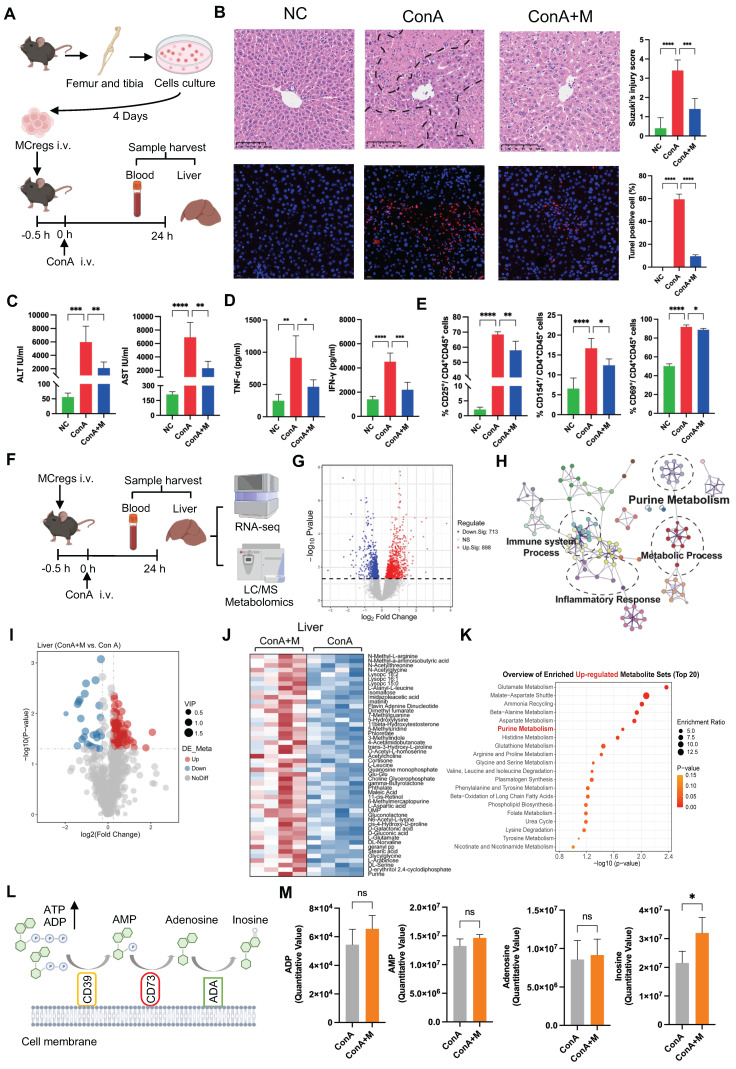
Figure 4.
MCregs play an immunomodulatory role in the liver by regulating purine catabolism. (A) After the adoptive transfer of MCregs into ConA-induced mice, the liver and blood were collected for subsequent analyses. (B) Hepatic tissues from the NC, ConA, and MCreg-treated groups (ConA+M) were subjected to H&E and TUNEL staining. H&E staining was used to assess the Suzuki injury score, while apoptotic cell ratios were determined via TUNEL staining (scale bar = 20 µm, n = 5). (C) Detection of the serum levels of ALT and AST in the mice (n = 5-6). (D) Detection of the serum levels of TNF-α and IFN-γ in the mice (n = 5-6). (E) The percentages of CD25-, CD69- and CD154-positive activated hepatic CD4+ T cells among the three groups (n = 5-6). (F) Bulk-RNA-seq and metabolomic analyses of blood and liver samples from the ConA and ConA+M groups (n = 4). (G) Volcano plot showing the DEGs between the ConA+M and ConA groups. (H) Pathway analyses based on the DEGs between the ConA+M and ConA groups. (I) Volcano plot showing the differentially metabolites between the ConA+M and ConA groups. (J) The top 50 upregulated differentially abundant metabolites in the liver between the ConA+M and ConA groups. (K) Pathway analyses based on the upregulated differentially abundant metabolites between the two groups. (L) Illustration of the purine metabolism process, involving the catabolism of ATP and ADP to AMP by CD39, which is further metabolized to adenosine (ADO) by CD73 and inosine (INO) by adenosine deaminase (ADA). (M) Comparison of the levels of ADP, AMP, ADO, and INO in the liver between the ConA and ConA+M groups.

