Figure 5.
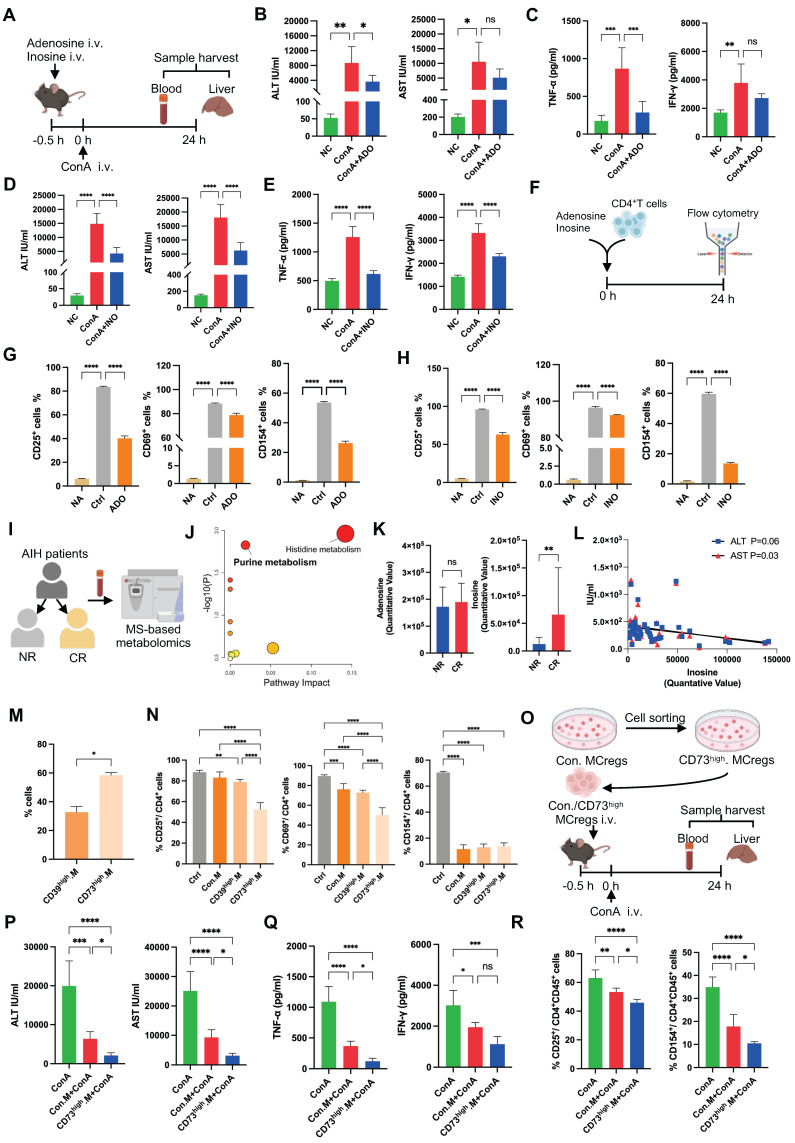
Immunomodulatory effects of MCregs via the CD73-adenosine/inosine axis. (A) Adenosine (ADO) and inosine (INO) were injected into ConA-induced mice via the tail vein, and the livers and blood were collected for subsequent analyses. (B-C) Serum levels of ALT/AST and TNF-α/IFN-γ in the different groups (n = 4-6). (D-E) Serum levels of ALT/AST and TNF-α/IFN-γ in the different groups (n = 4-6). (F) Flow chart of ADO and INO added to the culture of CD4+ T cells. (G) The percentages of CD25+, CD69+ and CD154+ activated CD4+ T cells among the untreated group (NA), control group (Ctrl) and ADO group. (H) The percentages of CD25+, CD69+ and CD154+ cells among activated CD4+ T cells in the NA group, Ctrl group and INO group. (I) AIH patients were categorized into nonresponsive (NR) and complete response (CR) groups, followed by plasma metabolomics analysis. (J) Pathway analyses based on the differentially abundant metabolites between the two groups. (K) The levels of ADO and INO in patients in the two groups. (L) Correlation analysis between INO levels and aminotransferase levels (ALT and AST). (M) The percentages of CD39 high-expressing (CD39high) and CD73 high-expressing (CD73high) MCregs before flow-sorting. (N) The percentages of CD25+, CD69+ and CD154+ cells among activated CD4+ T cells cultured with conventional (Con), CD39high and CD73high MCregs. (O) Flow-sorted CD73high MCregs were intravenously injected 0.5 h before ConA administration. Samples were harvested 24 h post-ConA administration. (P-Q) Serum levels of ALT/AST and TNF-α/IFN-γ in the ConA group, Con.MCreg-treated group (Con.M+ConA) and CD73highM+ConA group (n = 5-6). (R) The percentages of CD25+ and CD154+ activated CD4+ T cells in these three groups (n = 5-6).

