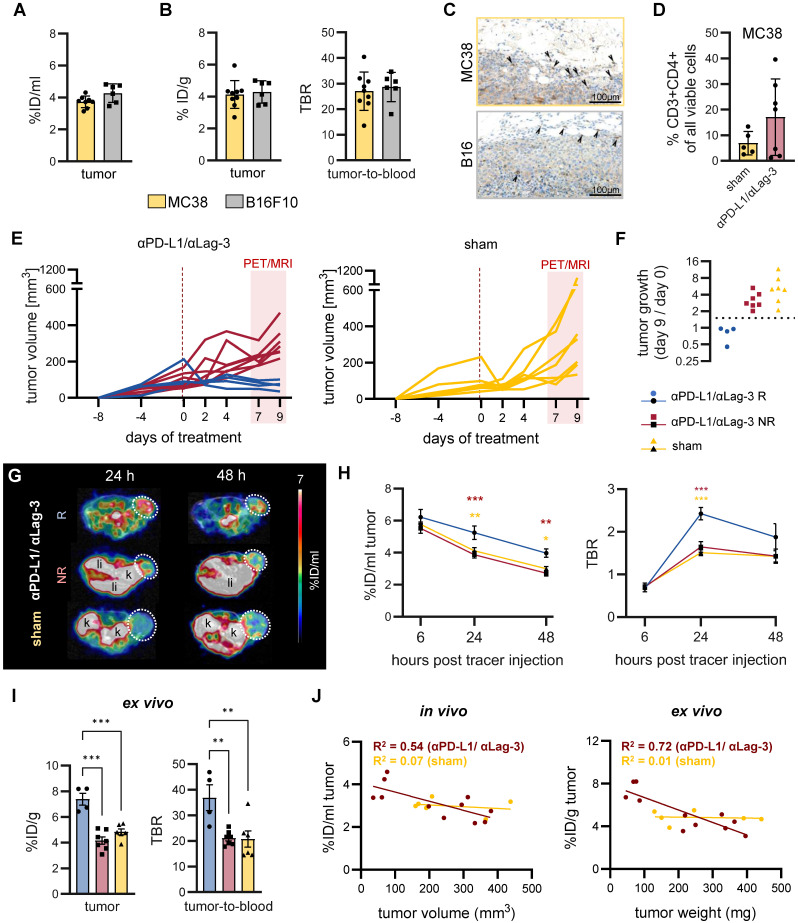
Figure 5.
In vivo 89Zr-mCD4-Mb PET for monitoring endogenous CD4+ cell dynamics in response to ICI therapy. (A) In vivo tumor uptake quantification of endogenous mCD4+ cells in subcutaneous MC38 (n = 9) and B16F10 (n = 6) tumors 48 h after 89Zr-mCD4-Mb tracer injection. (B) Ex vivo γ-counting of the tumor and ex vivo tumor-to-blood ratio (TBR) 48 h after 89Zr-mCD4-Mb injection. (C) Ex vivo mCD4 IHC of MC38 and B16 tumors. Black arrows indicate mCD4+ cells. (D) Fraction of intratumoral CD4+ cells of all cells from αPD-L1/αLag3-treated (n = 7) and sham-treated animals (n = 5) by flow cytometry. (E) MC38 tumor volumes (mm3) of αPD-L1/αLag-3-treated or sham-treated mice. The red rectangle indicates the PET/MR acquisition period at day 7 (6 h post tracer injection), day 8 (24 h), and day 9 (48 h). (F) Tumor growth ratio on day 9 vs. day 0 (baseline). Based on the tumor growth ratio (tumor volume at day 9 / tumor volume at day 0), mice were considered responsive (<1.5, R, blue) or non-responsive to treatment (>1.5, NR, red). (G) Representative in vivo PET/MR images 24 h and 48 h after 89Zr-mCD4-Mb tracer injection. Tumors are highlighted with a white circle. k: kidney; li: liver. (H) In vivo 89Zr-mCD4-Mb MC38 tumor uptake and tumor-to-blood ratio (TBR) were quantified at 6 h, 24 h, and 48 h post tracer injection. (I) Ex vivo quantification of 89Zr-mCD4-Mb uptake in MC38 tumors and tumor-to-blood ratio measured by γ-counting. (J) Correlation of in vivo (left) and ex vivo (right) 89Zr-mCD4-Mb uptake with the corresponding tumor volume and tumor weight, respectively, at 48 h after 89Zr-mCD4-Mb tracer injection. Data are derived from two independent experiments (αPD-L1/αLag3: n = 11, sham: n = 6; four mice were excluded from the study because of ulcerated tumors). *p < 0.05, **p < 0.01, ***p < 0.001.

