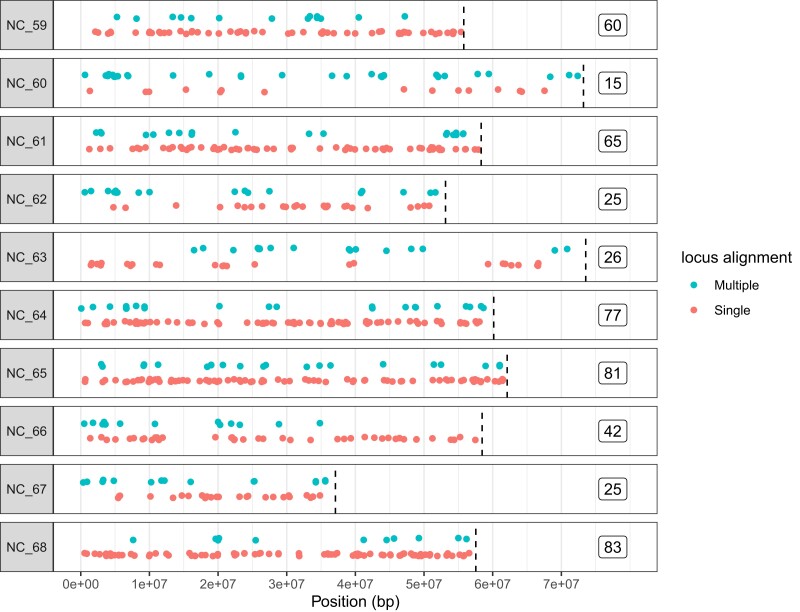
Fig. 1.
Positions of design sequences for the amplicon panel in the chromosome-level reference genome (GCF_902806645.1; Peñaloza et al. 2021). Most design sequences mapped to a single location (n = 499; red/lower), but some mapped to more than one position (teal green/upper, showing multiple locations for single amplicons), and were subsequently removed from the analysis. Chromosome ends are shown by hatched vertical lines, and the number of singly mapping design sequences per chromosome are shown to the right of the plot. Abbreviated NCBI chromosome names are shown to the left of the plot (e.g. NC_047559.1 to NC_59).

