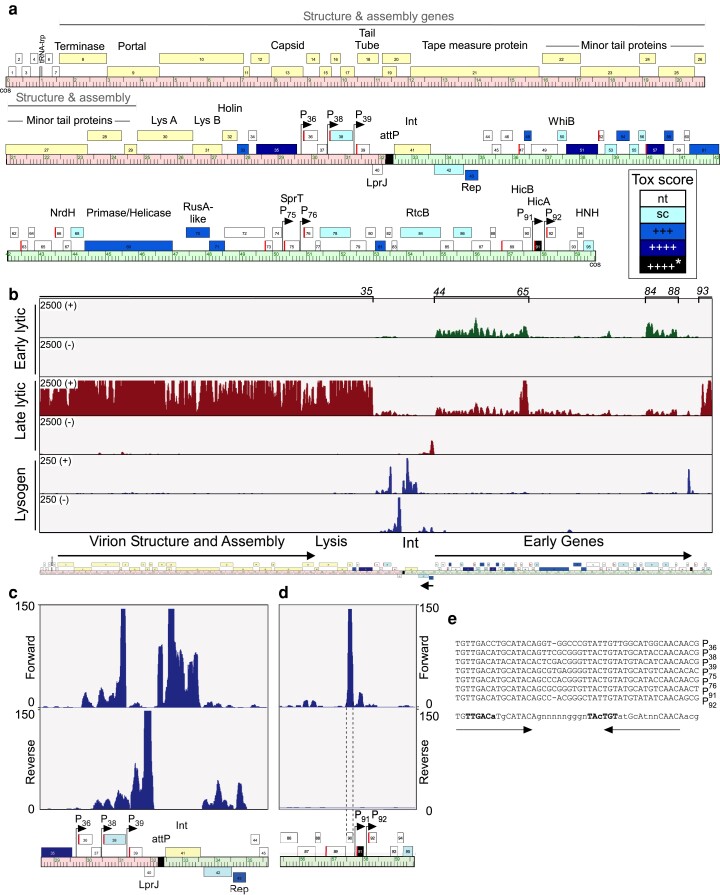
Fig. 1.
Mycobacteriophage Adephagia genome organization and expression. a) The Adephagia genome is shown as a ruler, with genes shown as boxes above or below the ruler (indicating right- or leftward transcription, respectively). The left arm (from cos to attP) is shaded light red and the right arm (attP to cos) is shaded light green. Putative protein functions are indicated above the corresponding genes, where known. The virion structure and assembly genes and the lysis cassette are indicated. The genes are colored in shades of blue according to the cytotoxic effect of the expressed protein, as indicated with the tox score scale (nt, nontoxic; sc, small colony phenotype; +++, reduction in EOP of 10−3; ++++, reduction in EOP of 10−4; ++++*, reduction in EOP of 10−4 in an integrative vector). Genes that were not tested for cytotoxicity are colored light yellow. Genes with a SAS are shown with a red bar at the start of the gene. The positions of 7 ESASs, each containing a putative promoter, are indicated with arrows, and the predicted promoters are indicated by the closest downstream gene. b) Transcription of the Adephagia genome. Sequencing reads obtained from RNA isolated during Adephagia early lytic infection (30 minutes; green) and Adephagia late lytic infection (210 minutes; red), as well as from an M. smegmatis mc2155(Adephagia) lysogen (blue), are mapped onto the Adephagia genome depicted below. Reads mapping forward (+) and reverse (−) strands are shown as indicated. Note that the read scale maximum is 2,500 for the lytic conditions, but only 250 for the lysogen. c) Expanded view of RNA-seq reads of the lysogenic sample in the central genomic region of the Adephagia genome. d) Expanded view of RNA-seq reads of the lysogenic sample in the gene 86–95 region. e) Extended SAS motifs in Adephagia with putative promoter sequences for genes 36, 38, 39, 75, 76, 91, and 92 as indicated to the right. A consensus sequence is shown at the bottom with putative −35 and −10 hexamer sequences shown in bold type; bases conserved in all sequences are shown in upper case and in lower case if present in at least 5 of the genomes.

