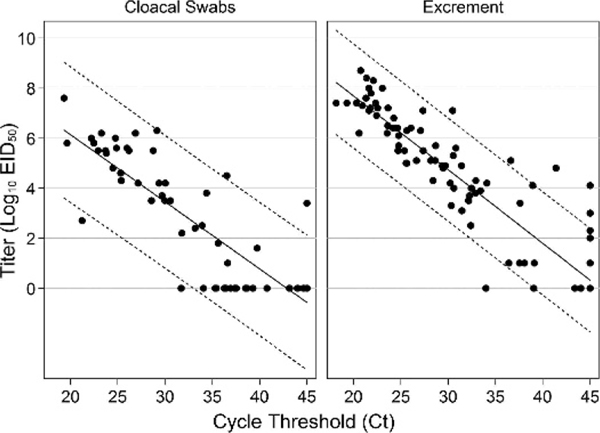
FIGURE 3.
Scatter plot of infectious titers versus cycle threshold (Ct) values for cloacal swabs and excrement samples collected from five Mallards (Anas platyrhynchos) during a 2-wk period after experimental infection with avian influenza virus. The solid lines are estimated regression lines and dotted lines are 95% prediction intervals. Viral titers are reported in log10 EID50/mL (cloacal swabs) or per gram (excrement samples).

