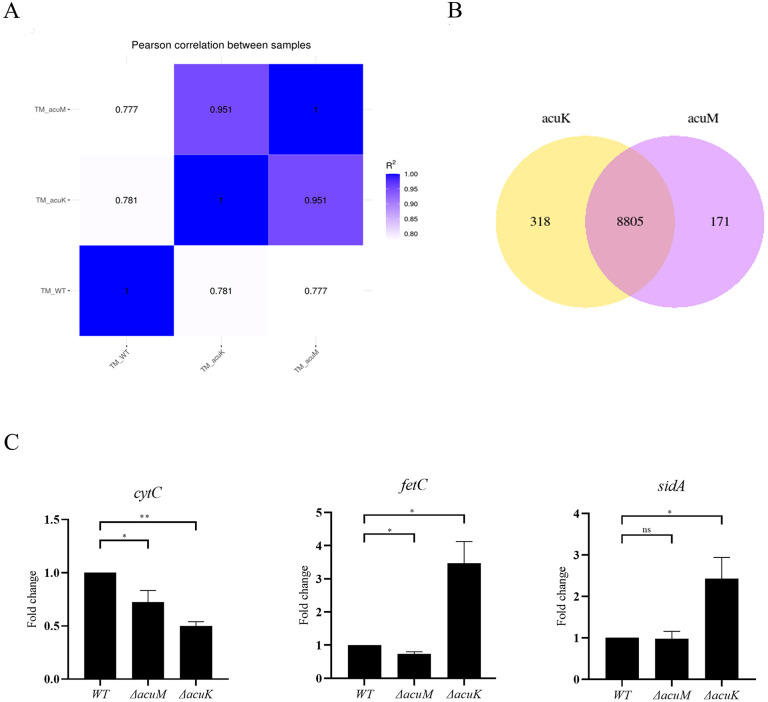
Fig 6. Transcriptome profiles of the acuK and acuM mutants were analyzed by RNA-seq experiment.
RNA-seq was performed in mold phase as described in materials and methods. (A) Heatmap depicted Pearson correlation coefficient (R2) between wild type, ΔacuK, and ΔacuM strains. (B) Venn diagram presented the number of DEGs that were uniquely and commonly expressed between the two mutants. C. Differential gene expression data from RNA-seq experiment was validated by qRT-PCR. Cultures and RNA samples were harvested as described in materials and methods. Error bars indicate standard deviation. Statistical analysis was performed using unpaired-t-test (GraphPad Prism version 7.00 for Windows). Statistically significant values (ns = non-significant, P>0.05, * P≤ 0.05, ** P≤ 0.01, *** P≤ 0.001, **** P≤ 0.0001) are indicated. Experiments were performed in three replicates.

