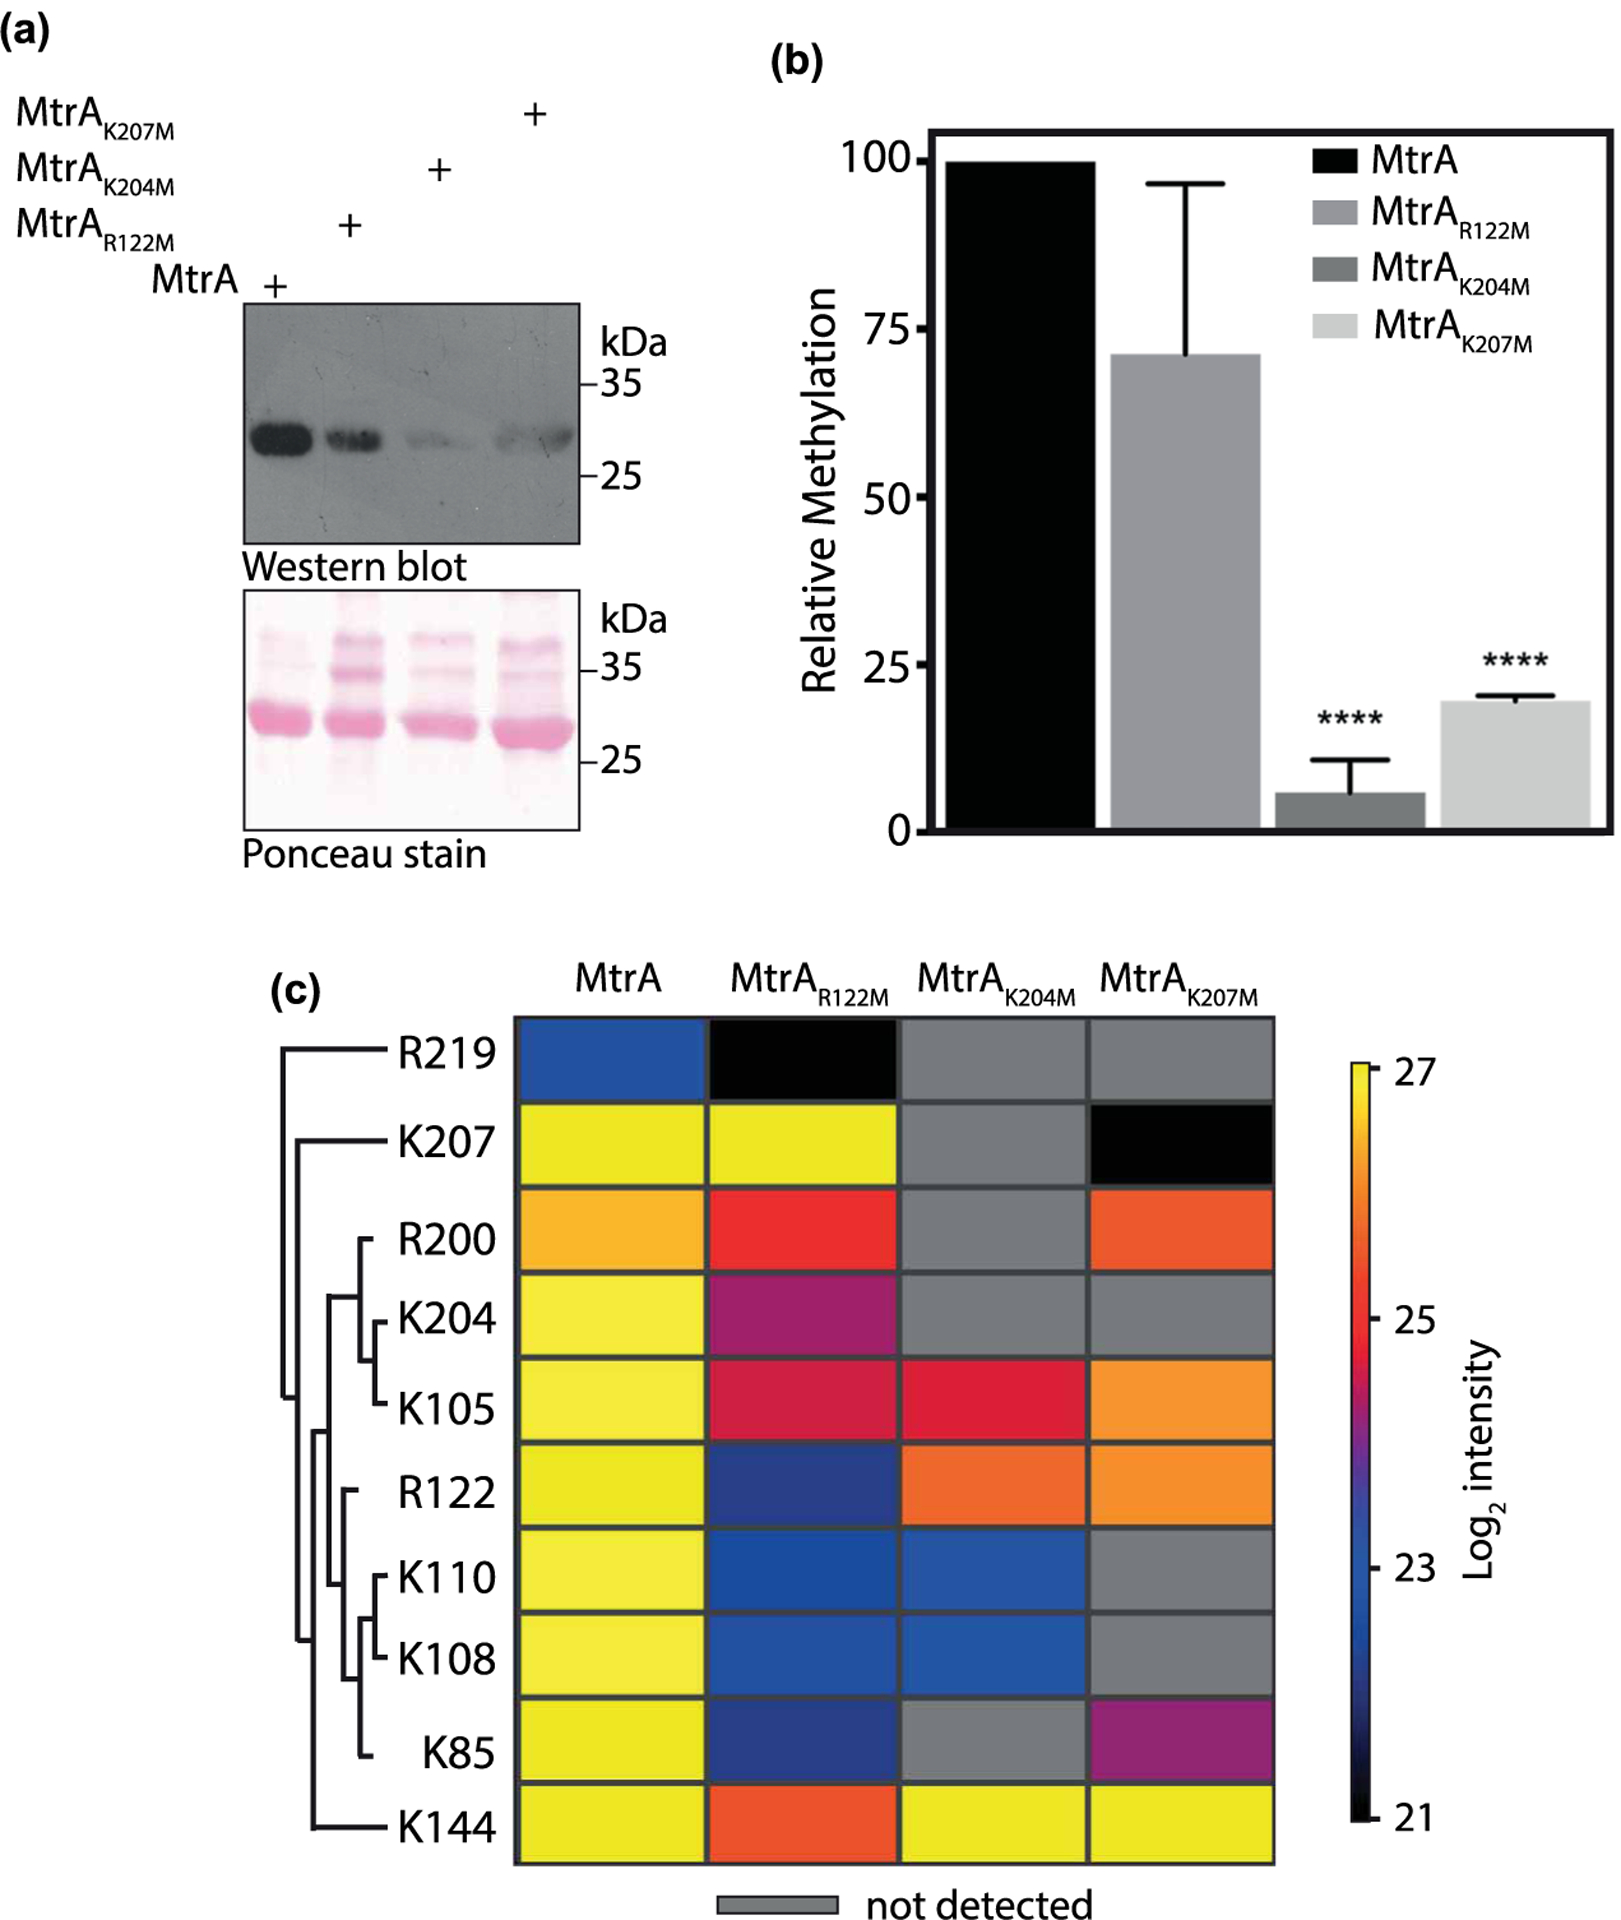
Figure 3. MtrA is methylated at lysine and arginine residues.

(a) MtrA and its mutants were overexpressed and purified from Msm. Purified proteins were loaded on SDS–PAGE, transferred on nitrocellulose, and probed with anti-methyllysine antibody. Ponceau-stained membrane image is shown in the lower image. (b) Densitometric analysis of the Western blot shown in (a). The bar graph depicts intensities obtained after normalization with protein amounts detected by ponceau staining. The intensity of methylated MtrA was considered as 100% and relative methylation intensities of mutants are plotted. Data (mean ± s.d.) are from three individual replicates. **** P ≤ 0.0001, as determined by two-tailed unpaired Student’s t-test. (c) Heat map showing the effect of mutation of R122, K204, and K207 residues on methylation intensities at other sites. Each row depicts the residue at which quantitative analysis was performed and each column represents the protein analyzed. Mass spectrometric intensities are color-coded according to the key given below the heat map (log2 scale).
