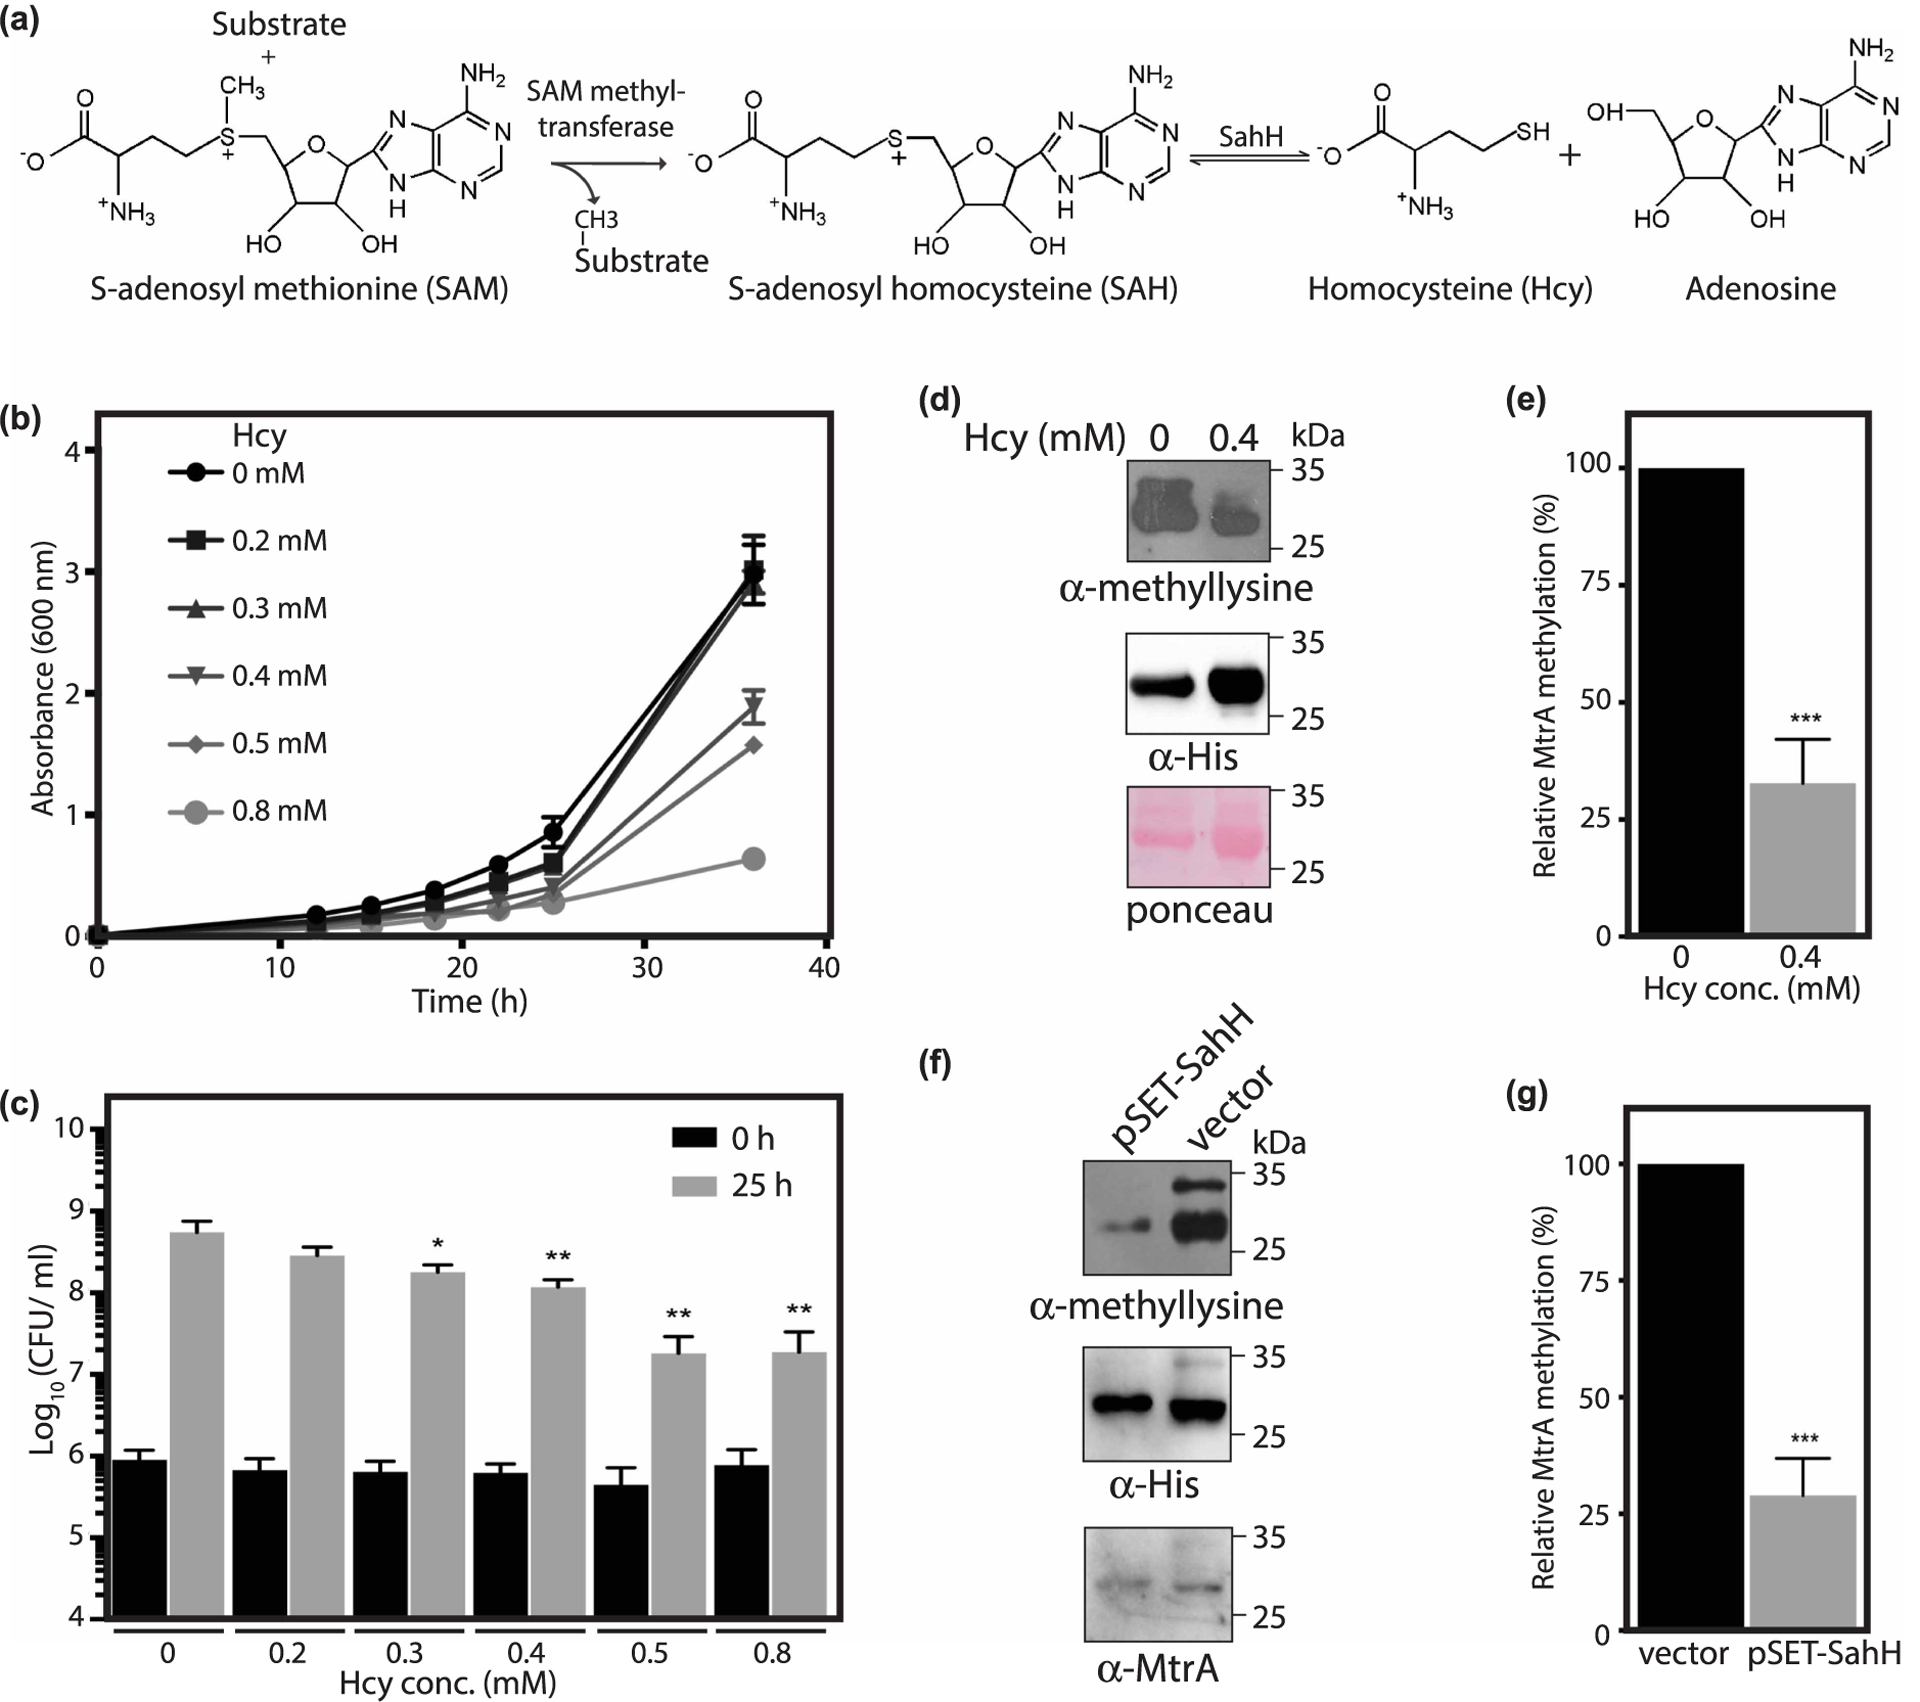
Figure 5. The perturbation of metabolic intermediate levels influences MtrA methylation.

(a) Reaction showing the synthesis of Hcy from SAH catalyzed by SahH. (b,c) Msm cells were grown in the presence of 0–0.8 mM Hcy and growth was measured. Data (mean ± s.d.) are from four individual replicates. (b) A600 was plotted as a function of time. (c) Graph shows Log10(CFU/ml) calculated during the exponential growth phase as a function of Hcy concentration. (d, e) MtrA was expressed and purified from Msm using Ni2+-NTA chromatography in the absence or presence of 0.4 mM Hcy. (d) Immunoblotting was performed using anti-methyllysine antibody followed by an anti-His6 antibody. (e) Graph showing the relative methylation of MtrA in the presence of Hcy with respect to methylation of MtrA in the absence of Hcy. Methyllysine intensities were normalized to MtrA protein levels as measured by anti-His6 immunoblot. Data (mean ± s.d.) are from three individual replicates. (f,g) MtrA was expressed and purified from Msm strain that overexpressed SahH using Ni2+-NTA chromatography. (f) Immunoblotting was performed using anti-methyllysine antibody followed by anti-His6 and anti-MtrA antibodies. (g) Graph showing the methylation of MtrA in the presence of overexpressed SahH relative to the methylation of MtrA in the presence of vector control. Methyllysine intensities were normalized to MtrA protein levels as measured by anti-His6 immunoblot. Data (mean ± s.d.) are from three individual replicates. * P ≤ 0.05, ** P ≤ 0.01, *** P ≤ 0.001, as determined by two-tailed unpaired Student’s t-test.
