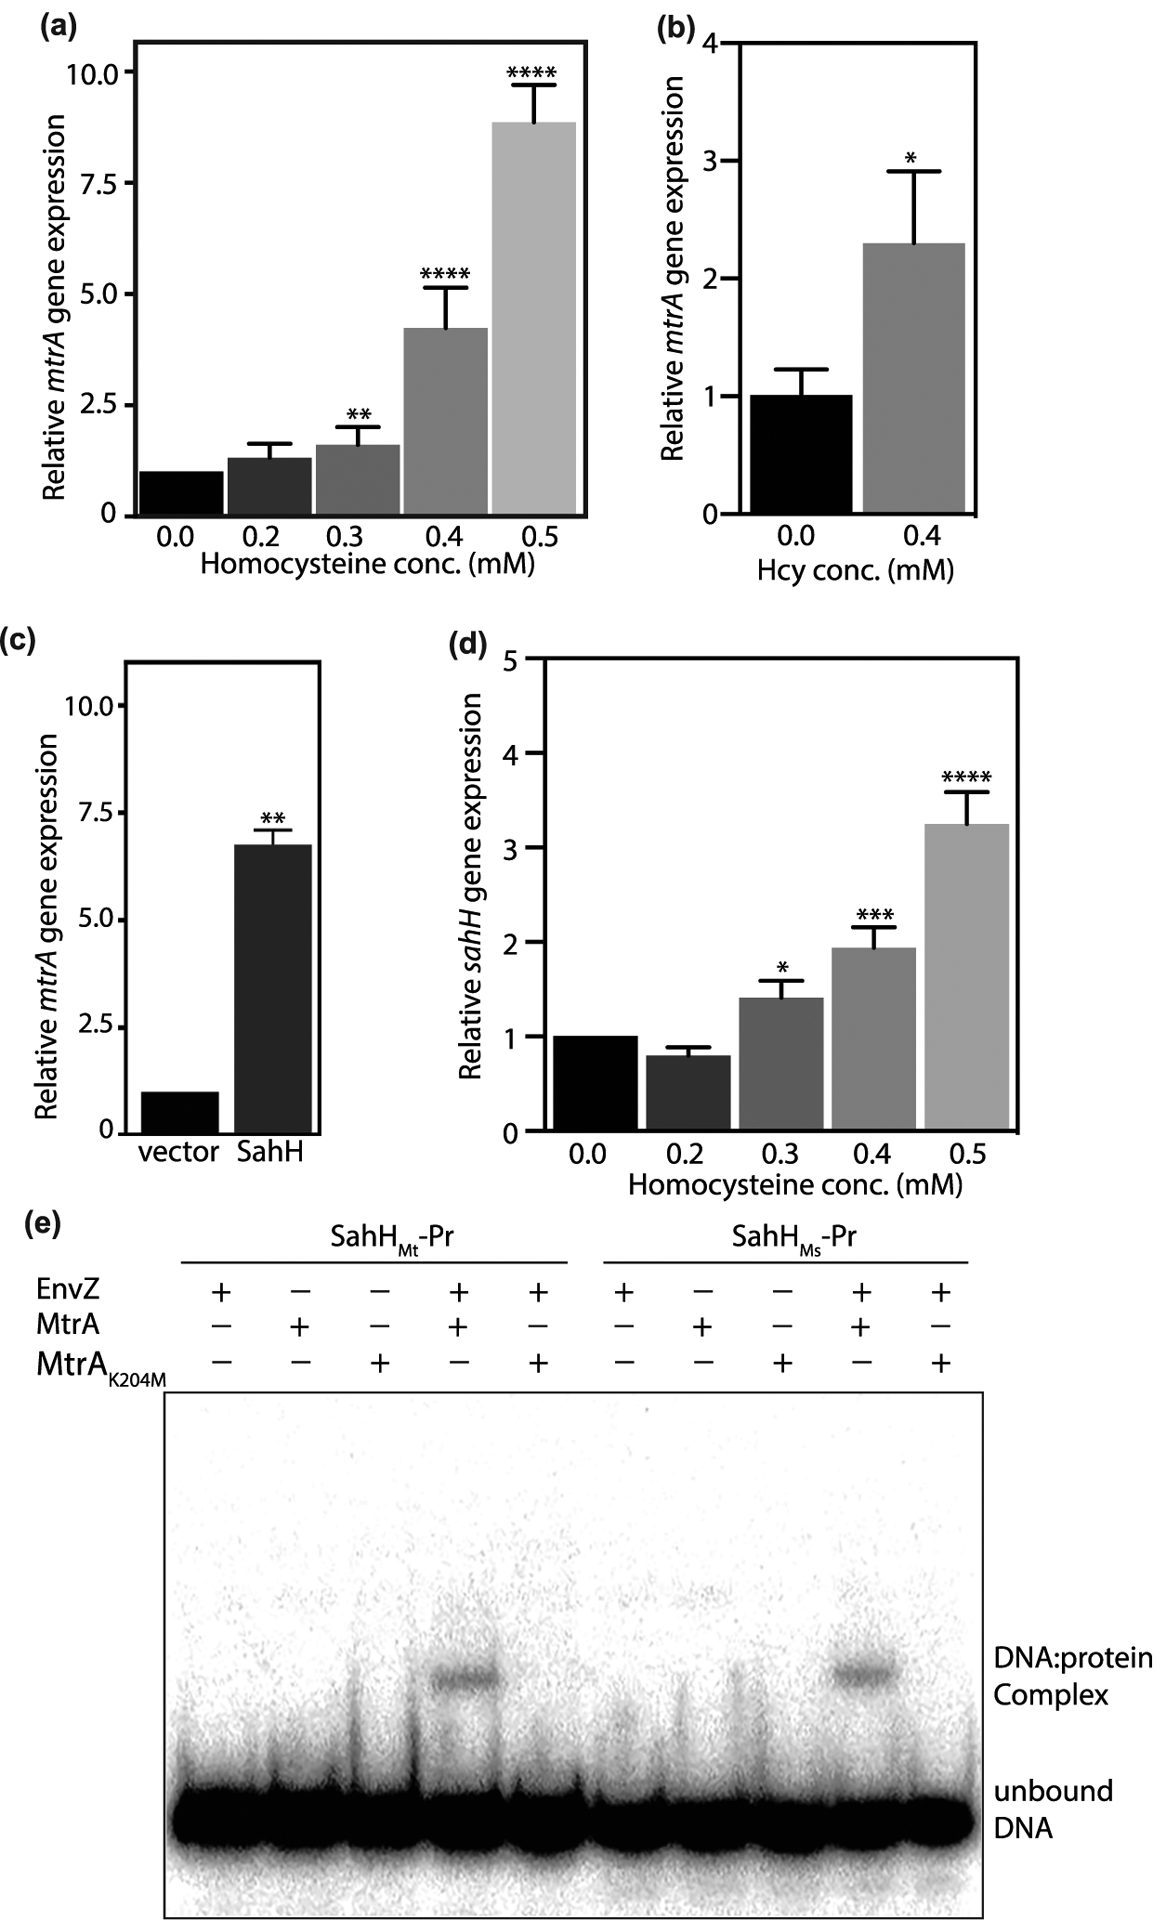
Figure 6. MtrA methylation negatively regulates transcriptional activation.

(a–c) mtrA expression was analyzed using qRT-PCR in Msm cultures grown in the presence of Hcy (a,b) or SahH overexpression (c). Expression level of mtrA was analyzed with respect to sigA (a,c) or 16S rRNA (b). (d) sahH expression was analyzed using qRT-PCR in Msm cultures grown in the presence of Hcy with respect to sigA. Data (mean ± s.d.) are from six (a) or three (b,c, and d) biological triplicates. * P ≤ 0.05, ** P ≤ 0.01, **** P ≤ 0.0001 as determined by two-tailed unpaired Student’s t-test (compared with control values). (e) DNA binding assay was performed using putative sahH promoter fragments from Mtb (sahHMt-Pr) or Msm (sahHMs-Pr). MtrA and MtrAK204M were used in unphosphorylated or phosphorylated forms. The reactions were resolved on native PAGE and gels were autoradiographed. DNA:protein complex and the unbound DNA are shown.
