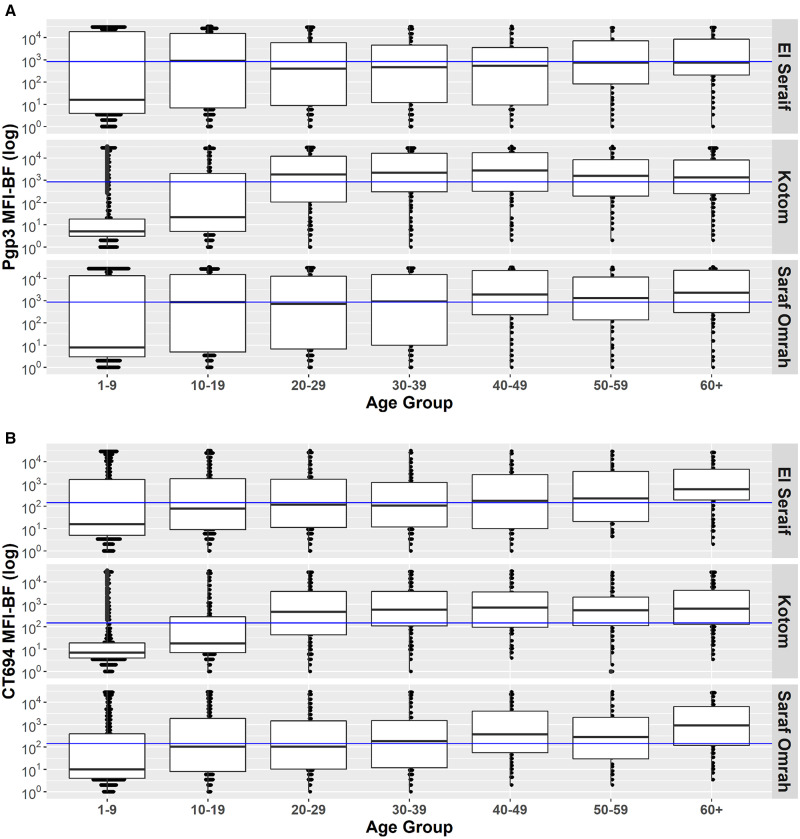
Figure 4.
Distribution of antibody responses to A) Pgp3 and B) CT694 by age group within the three surveyed localities in North Darfur, Sudan, 2019–2020. Blue line signifies the positive threshold. MFI-BF = median fluorescence intensity minus background. Boxes represent the median and the 25th and 75th quartiles. Bars represent the range.

