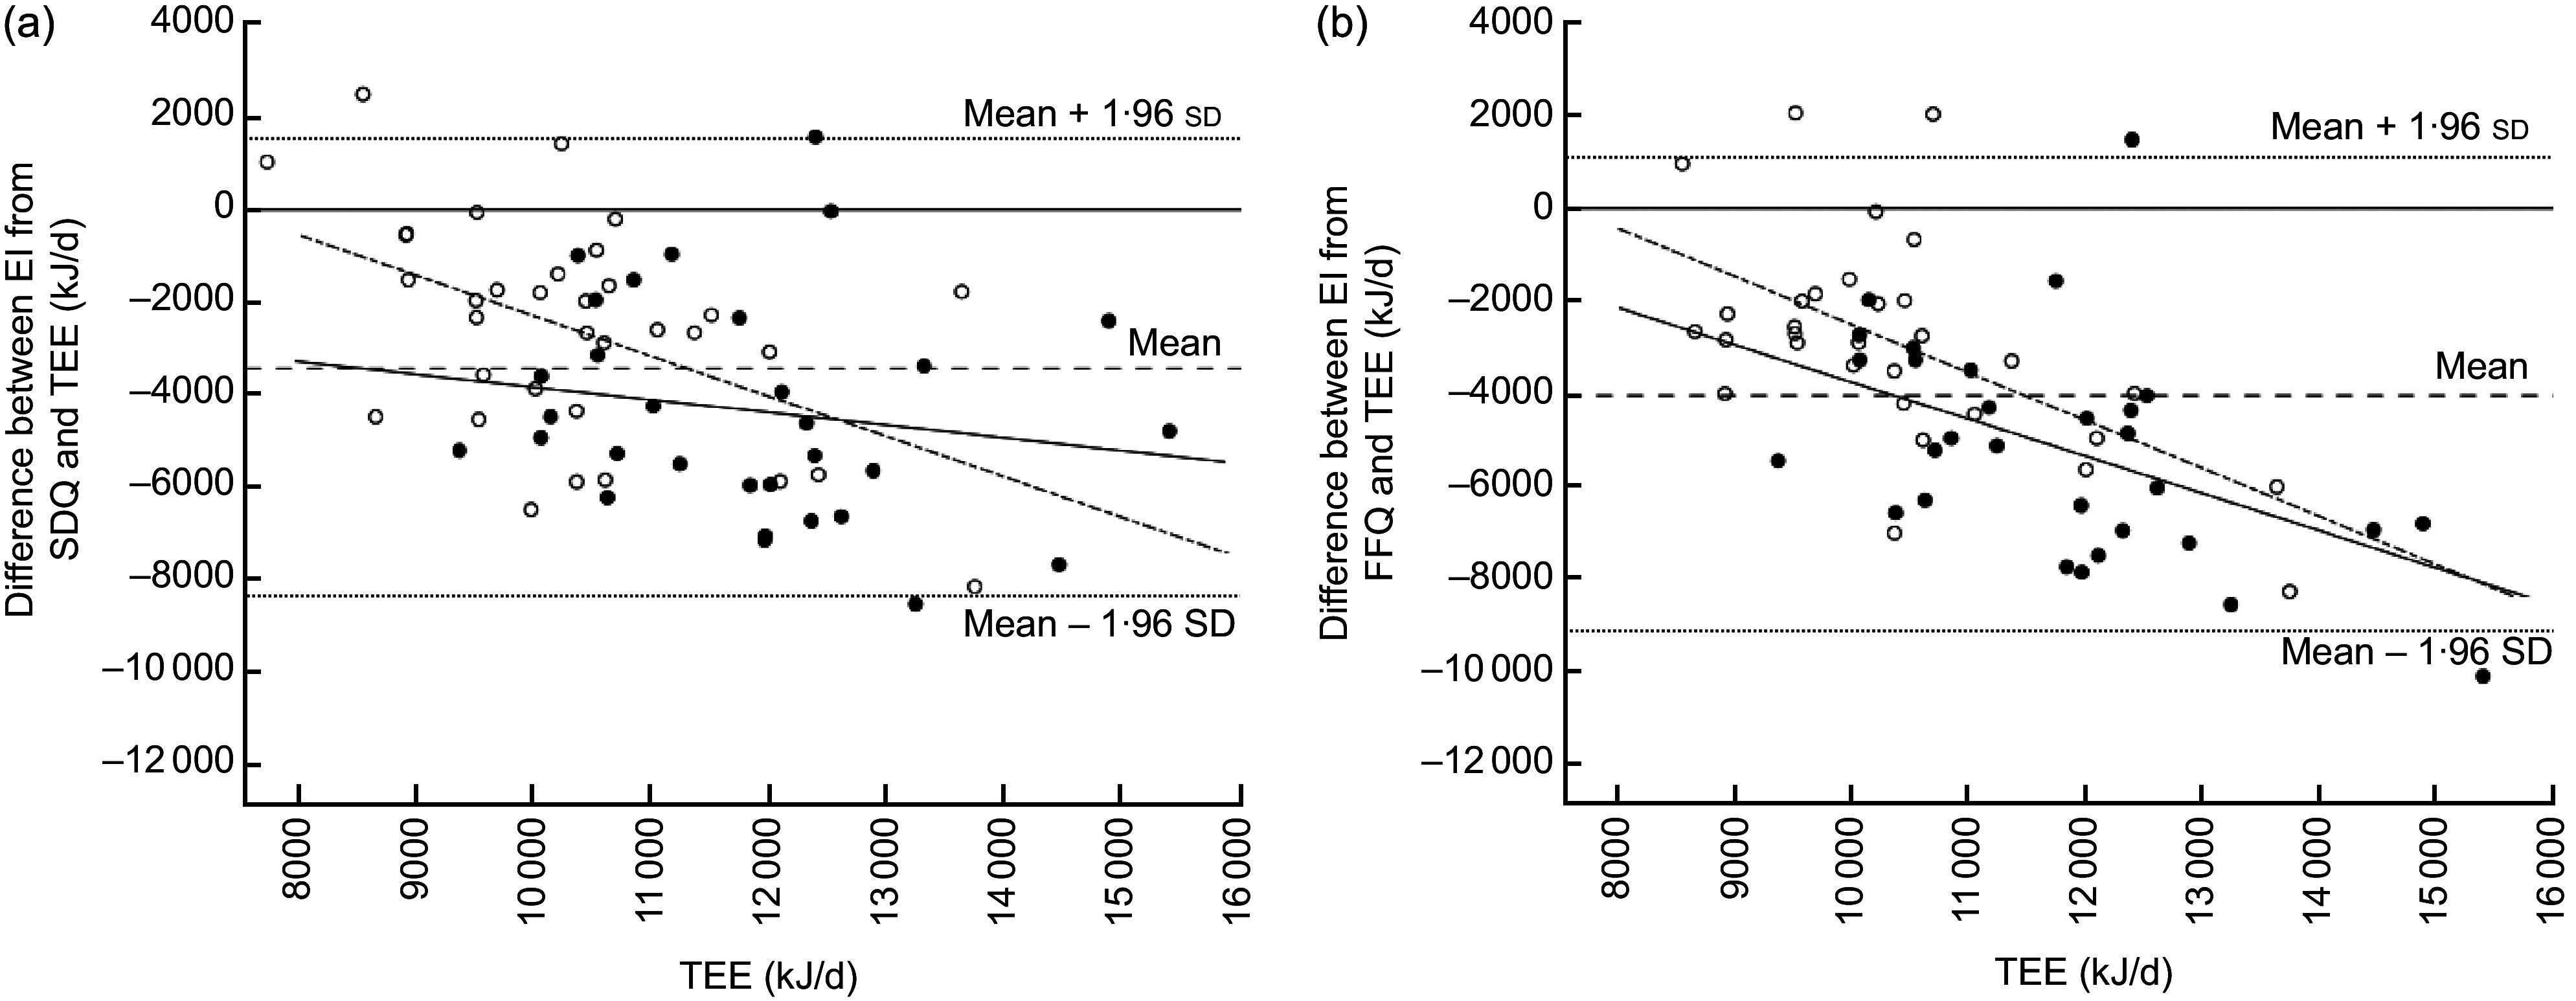
Fig. 1.

Bland–Altman plots comparing energy intake (EI) of non-pregnant women (n 65) assessed with (a) a short dietary questionnaire (SDQ) and (b) a more extensive FFQ (n 61) against total energy expenditure (TEE) measured with the doubly labelled water method, Västerbotten, northern Sweden, 2008–2009. Normal-weight women are displayed as ○ and overweight/obese women as •. Difference between EI and TEE is shown on the y-axis and TEE on the x-axis. The mean difference is displayed as – – – – – and the limits of agreement (mean ± 1·96 sd) are displayed as ······. The regression lines are displayed for normal-weight women ( – - – - – ) and overweight/obese women (———)
