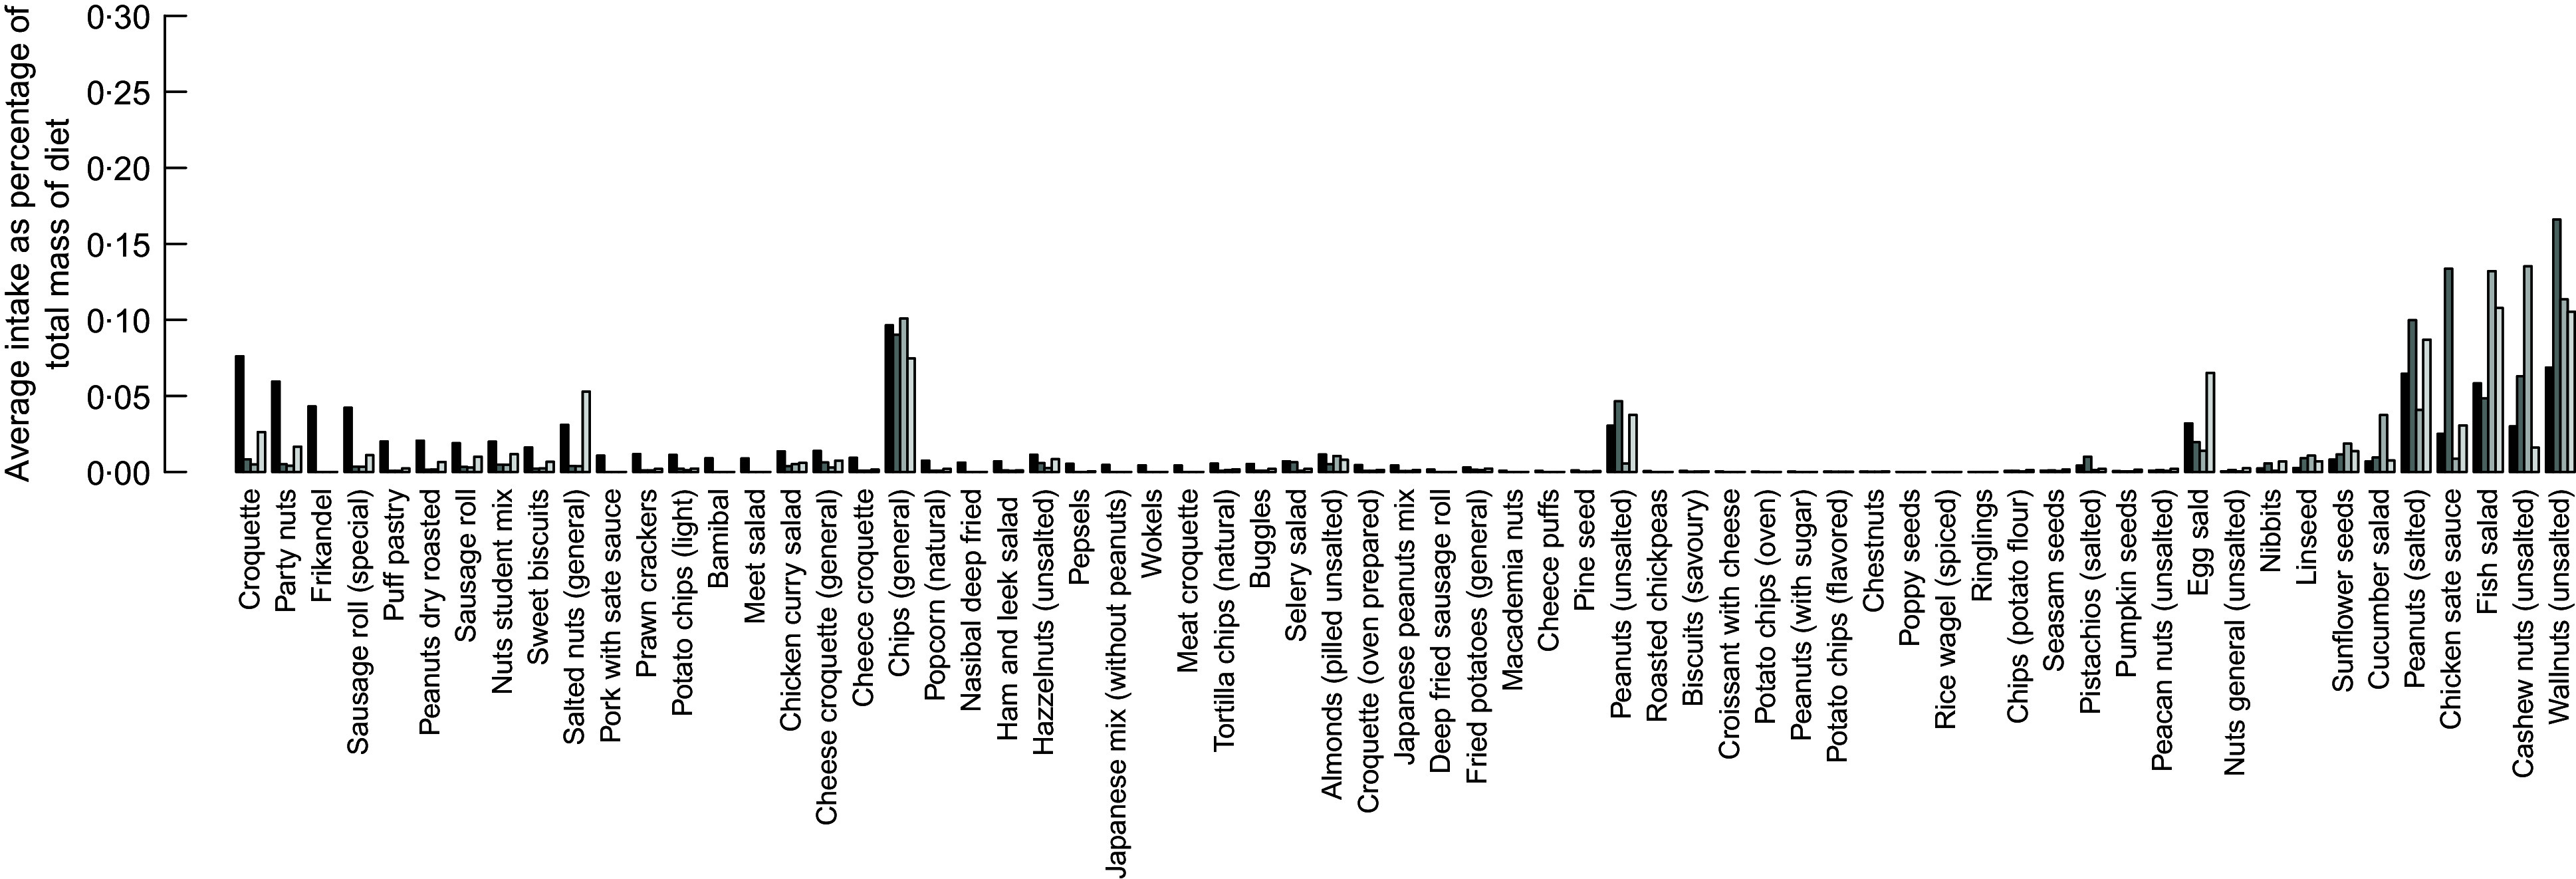
Fig. 7.

Detailed average intake of food items that belong to the nuts, seeds and snack group for male consumer of the dataset.  , Current diet;
  , diet calculated with input-oriented data envelopment analysis (DEA) model;
  , diet calculated with output-oriented DEA model;
  , diet calculated with MINDV model
