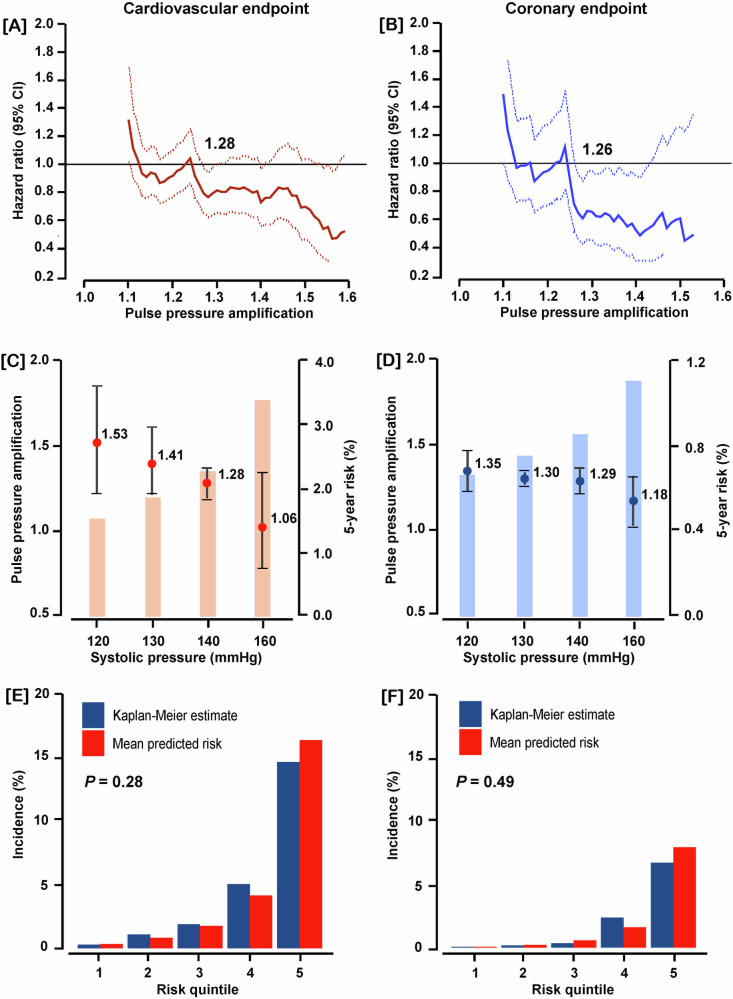
Fig. 2.
Threshold and calibration of pulse pressure amplification (PPA) in the discovery sample including 3945 participants. Hazard ratios (HRs) express the risk at each PPA level relative to the average risk in the whole discovery sample for cardiovascular (A) and coronary endpoints (B). The upper confidence limit crosses unity, denoted by the vertical line, at 1.28 and 1.26 for cardiovascular and coronary endpoints, signifying decreased risk. The PPA levels yielding equivalent 5-year risks compared with a systolic blood pressure of 140 mmHg were 1.28 and 1.29 for the cardiovascular (C) and coronary (D) endpoints, respectively. Model calibration for the cardiovascular (E) and coronary (F) endpoints demonstrated that across PPA quintiles the predicted risk was similar compared with the overoptimism-corrected Kaplan–Meier estimates. All analyses were multivariable adjusted for cohort (random effect), sex, age, body mass index, heart rate, smoking and drinking, total-to-HDL serum cholesterol ratio, estimated glomerular filtration rate, antihypertensive drug intake, history of cardiovascular disease, and diabetes

