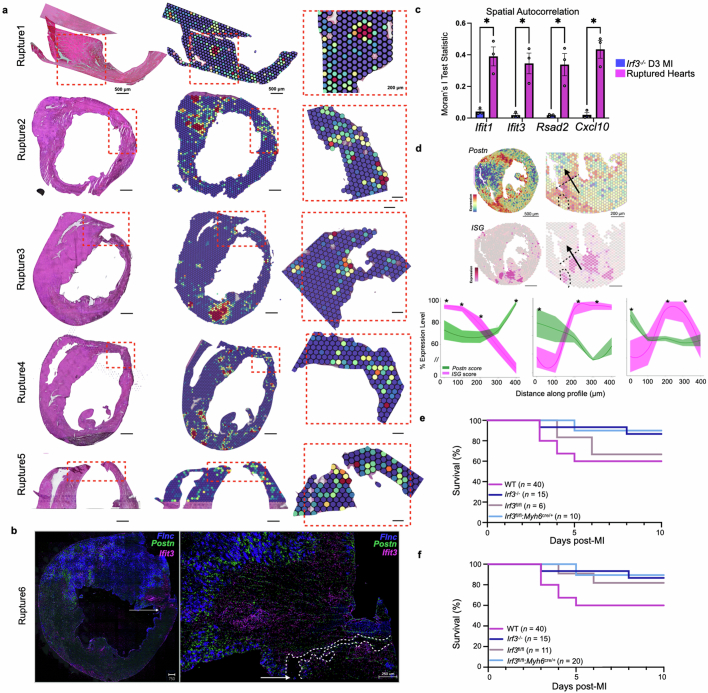
Extended Data Fig. 8. IFNIC colonies and ISG expression appear directly adjacent to the site of ventricular rupture.
(a) Infarcted mice were monitored during D3-D7 post-MI for sudden death and rapidly collected by flash-freezing to preserve RNA integrity. Representative images of 7 collected rupture samples from WT mice show IFNIC colonies directly adjacent to the site of ventricular rupture (n = 7). (b) In situ hybridization of ruptured cardiac cross section with representative Flnc (blue), Postn (green), and Ifit3 (magenta). Clustering of Ifit3 to the site of rupture is seen and demarcated by white dotted line. (c) Moran’s I test statistic for each ISG was computed in ruptured heart samples compared to Irf3−/− hearts (n = 3 mice per condition). (d) Line scans were performed in WT D3 MI samples to quantify the inverse correlation between Postn (Supplementary Table 2) and ISG scores along a diagonal vector (n = 3 mice). (e) Post-MI survival performed with WT (n = 40 mice), Irf3−/− (n = 15 mice), Irf3fl/fl:Myh6cre/+ (n = 10), and Irf3fl/fl littermate controls (n = 6). Littermate controls from this cohort matched WT survival as expected. (f) Littermate controls from the second cohort exhibited 100% survival (n = 5). Given the potential batch effect, the littermate controls are thus underpowered. Spatial correlation coefficients were transformed with Fisher’s Z and compared using two-tailed unpaired t-tests (c). ANCOVA with LOESS moving average and regression analysis was used in (d). Data presented as mean values ± s.e.m. and *P < 0.05. Results in (a-c) are representative of 4 independent repeats.

