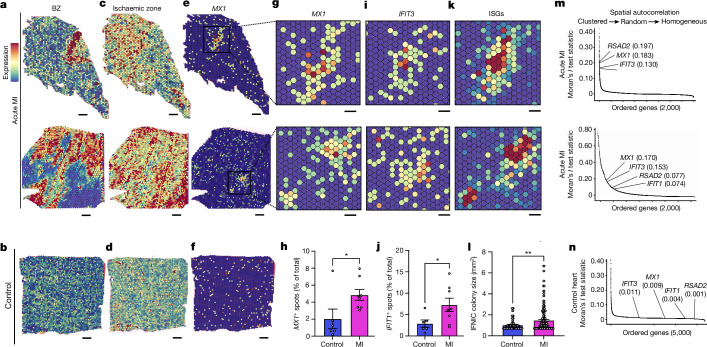
Fig. 2. MI induces focal colonies of IFNICs in humans.
Spatial transcriptomics analysis of tissue sections from infarcted human hearts or controls. a,b, Human BZ gene scores (Supplementary Table 3.1) in two representative infarcted hearts (a) and one control heart (b). c,d, Human ischaemic zone gene score (Supplementary Table 3.2) for the same infarcted (c) and control (d) hearts. e,f, Representative ISG expression (MX1) for the same infarcted (e) and control (f) hearts. g–l, Magnified views of IFNIC gene expression in the same infarcted hearts for MX1 (g), IFIT3 (i) and the ISG score (k) (Supplementary Table 3.3), and quantification of MX1+ (h) and IFIT3+ (i) pixels per section and IFNIC colony size (l). n = 6 non-infarcted or RZ individuals, n = 8 individual hearts. m,n, Moran’s I test statistics of the top 2,000 variable features with annotated ISGs within represented samples in infarcted (m) and control (n) human hearts. Data were analysed using two-tailed Student’s t-tests (h, j and l) and one-sided Moran’s I test statistic with Benjamini–Hochberg FDR adjustment (m and n). Data are mean ± s.e.m. The results in a–n are representative of three independent repeat analyses. Scale bars, 500 μm (a–f) and 200 μm (g, i and k).

