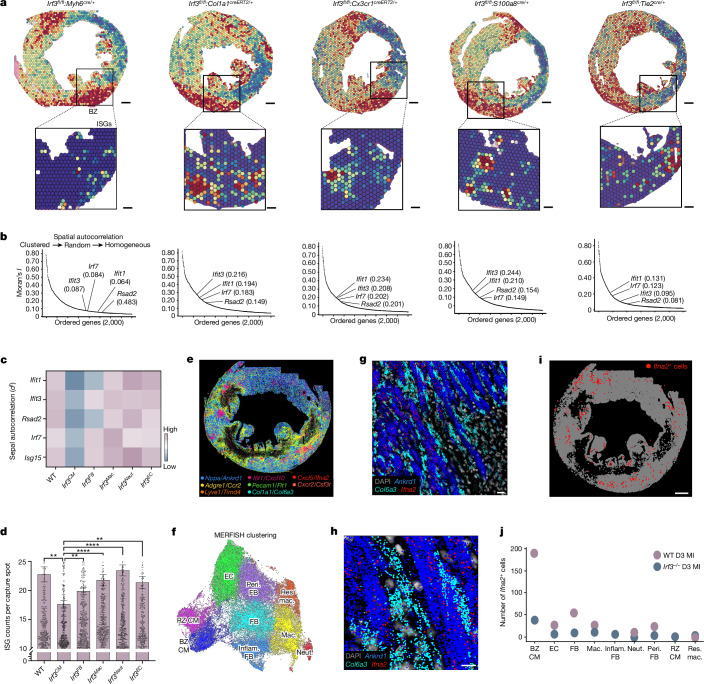
Fig. 3. Cardiomyocytes are dominant initiators of the type I IFN response in MI.
Sequencing-based spatial transcriptomics performed on cell-type-specific Irf3-knockout hearts collected at day 3 after MI. a, BZ gene scores in cell-type-specific Irf3-knockout mice (top) with magnified ISG scores shown in conditional knockout mice (bottom). b, Moran’s I test statistic of the top 2,000 variable features with annotated ISGs with represented conditional knockout samples. c, Sepal scores derived from diffusion-based modelling to assess spatial autocorrelation. n = 4 WT mice and n = 2 mice per genotype. d, Gene counts of ISG score were summed in each spatial sequencing spot and thresholded to remove spots with counts of <10 in WT and transgenic mice. n = 4 WT mice, 9,273 transcriptome spots; n = 2 Irf3CM mice, 4,928 spots; n = 2 Irf3FB mice, 4,841 spots; n = 2 Irf3Mac mice, 4,734 spots; n = 2 Irf3Neut mice, 4,860 spots; and n = 2 Irf3EC mice, 4,310 spots. e–j, RNA MERFISH analysis was performed in WT and Irf3−/− hearts at day 3 after MI. e, Representative image of cell marker probes used in cell clustering. f, Uniform manifold approximation and projection (UMAP) analysis of annotated cells from WT and Irf3−/− hearts at day 3 after MI. Data of cells from Irf3−/− hearts at day 3 after MI were ingested with data of WT day 3 MI heart using Scanpy. n = 44,606 cells, 1 WT mouse; n = 41,953 Irf3−/− cells, 1 Irf3−/− mouse. RZ CM, remote zone cardimyocyte; BZ CM, borderzone cardiomyocyte; EC, endothelial cell; Peri FB, perivascular fibroblast; FB, fibroblast; Inflamm FB, inflammatory fibroblast; Res Mac, resident macrophage; Mac, infiltrating macrophage; Neut, neutrophil. g,h, Representative localization of type I IFN Ifna2 (red), BZ cardiomyocyte gene Ankrd1 (blue) and fibroblast gene Col6a3 (cyan) (g) with a magnified view shown below (h). i,j, Ifna2 transcripts assigned to individual cells represented by red circles as Ifna2+ cells (i) and quantification of Ifna2+ cells (j) in WT and Irf3−/− mice. Data were analysed using one-tailed Moran’s I test statistic with Benjamini–Hochberg FDR adjustment (b) or one-way ANOVA with Bonferroni’s (c) or Dunn’s (d) correction for multiple-comparison testing. Data are mean ± s.e.m. ****P < 0.0001. Results in a and b are representative of two independent repeated experiments. Scale bars, 750 μm (i), 500 μm (a, top), 200 μm (a, bottom) and 150 μm (g and h).

