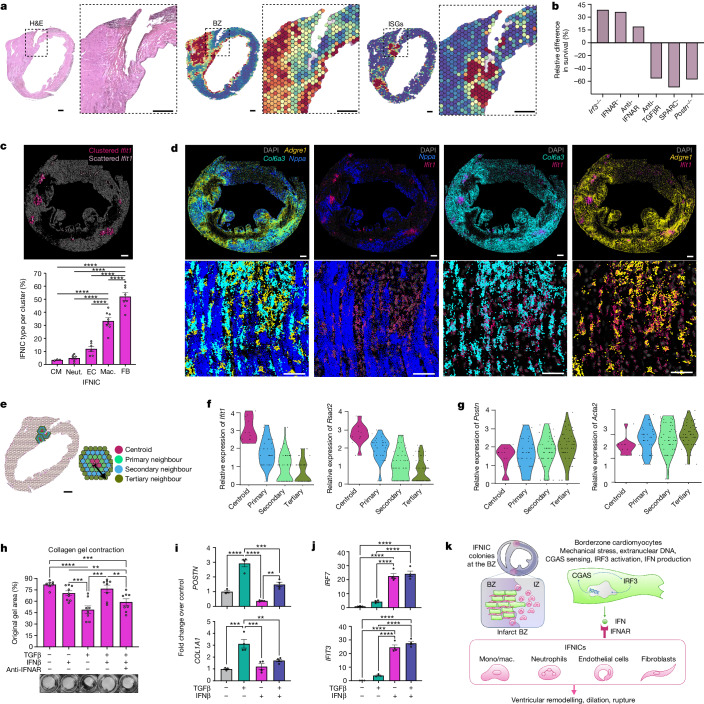
Fig. 5. MI-induced IFNIC colonies co-localize at ventricular rupture sites.
a, Representative haematoxylin and eosin (H&E) staining, BZ score and ISG score with magnified insets of the ventricular rupture site. b, The relative difference in post-MI survival in cited studies that inhibited type I IFN signalling or fibroblast activation3,40–43. c, Clustered and scattered expression of Ifit1 were identified using density-based clustering (DBSCAN). The relative proportion of each cell type within each cluster is shown below. n = 1,250 cells in 8 clusters, 1 mouse. d, Fluorescent cell-type-specific probes for Nppa (cardiomyocytes; blue), Col6a3 (fibroblasts; cyan), Adgre1 (macrophages; yellow) and Ifit1 (ISG, magenta) from RNA MERFISH (top). Bottom, magnified view within IFNIC colony 7 from c. e, ISG scores were processed for k-means clustering, and spots with the highest expression were designated as centroids, and adjacent spots were designated as primary, secondary or tertiary neighbours. n = 4 mice. f,g, Differential gene expression analysis comparing ISG neighbours versus centroid, and selected genes are shown in violin plots for Ifit1 and Rsad2 (f), and Postn and Acta2 (g). h, Collagen gel contraction using human iPS-cell-derived fibroblasts as untreated controls (n = 7) or treated with 10 ng ml−1 IFNβ1 (n = 8), 10 ng ml−1 TGFβ (n = 9), IFNβ1 + TGFβ (n = 8) or IFNβ1 + TGFβ + anti-IFNAR antibody (n = 8). i,j, Matricellular (i) and ISG (j) gene expression in cells treated similarly to in h. k, The proposed model in which BZ cardiomyocytes are dominant initiators of IFNIC colonies leading to pathogenic IRF3-dependent responses to MI. Data were analysed using one-way analysis of variance (ANOVA) with Bonferroni’s post hoc test (c, i and j), two-way ANOVA with Tukey’s post hoc test (h) and Wilcoxon rank-sum tests (f and g). Data are mean ± s.e.m. The results in h–j are representative of two independently repeated experiments. Scale bars, 750 μm (c and d (top)), 500 μm (a), 200μm (d (bottom)) and 100 μm (e).

