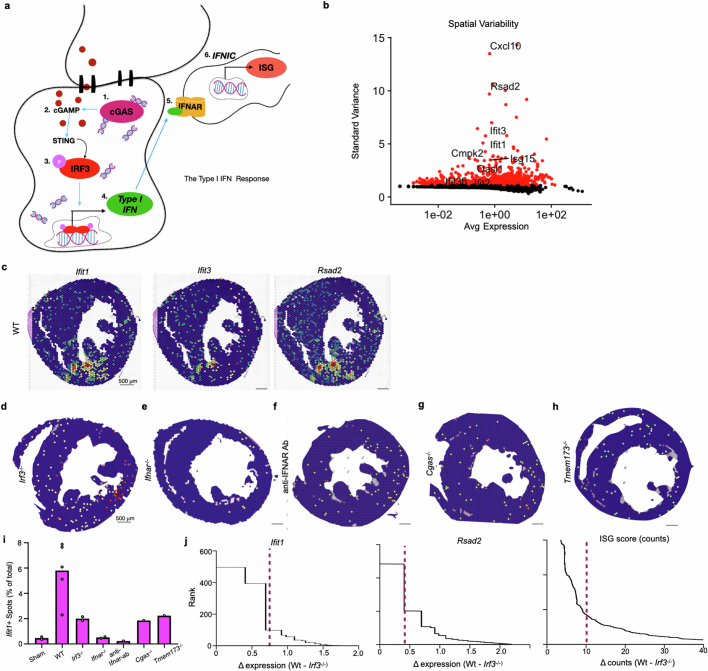
Extended Data Fig. 1. The type I IFN response produces spatially clustered ISG expression.
(a) Representative depiction of the type I IFN pathway. The primary response involves cGAS sensing of decompartmentalized dsDNA in the cytosol and resulting 2nd messenger production of cGAMP. This activates the STING adaptor resulting in phosphorylation and activation of the master transcriptional regulator IRF3. Translocation of IRF3 into the nucleus induces expression and secretion of type I IFN cytokines which signal to bystander cells via binding to the IFNAR receptor in an autocrine or paracrine manner. IFNAR-binding results in the expression of hundreds of interferon stimulated genes (ISGs) as a robust readout of the secondary response and delineation of IFNICs. (b) Spatially variable features were calculated by Seurat’s FindVariableFeatures() using vst as the selection method. Standard variance plotted against log normalized average expression of highly variable features. ISGs were among the 2000 topmost variable features labelled. (c) Interferon stimulated genes projected onto space in a D3 post-MI cardiac section. (d-h) Genetic knockout mice of signalling components in the cGAS-STING-IRF3 axis were infarcted and harvested D3 post-MI for spatial transcriptomic analysis. Representative Ifit1 expression in infarcted (d) Irf3−/− (n = 2 mice), (e) Ifnar−/− (n = 2 mice), (f) anti-IFNAR-ab treatment (n = 1 mouse), (g) Cgas−/− (n = 1 mouse) and (h) STING−/− (Tmem173) hearts (n = 1 mouse). (i) Number of positive spots (above zero) for Ifit1 expression for infarcted WT and genetic knockout mice of the cGAS-STING-IRF3 signalling axis. (j) Ranked plots for Ifit1 expression (.70), Rsad2 expression (.45), and gene counts of the ISG score (10) by measuring the difference between WT and Irf3−/− (n = 2 mice per genotype).

