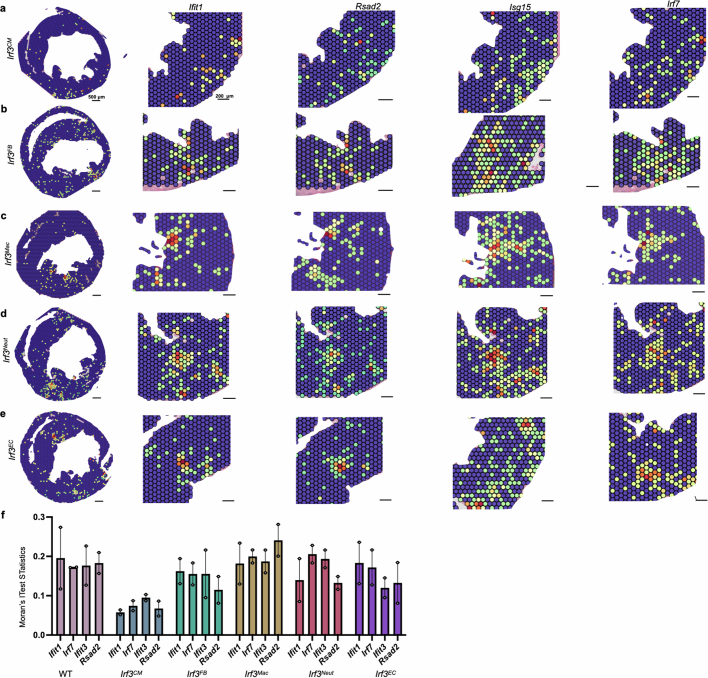
Extended Data Fig. 4. IFNIC colonies are initiated by BZ cardiomyocytes.
(a) Representative images of 4 individual ISGs in cardiomyocyte- (b) fibroblast- (c) macrophage- (d) neutrophil-, and (e) endothelial-specific deletions of Irf3. (f) Ranked percentile of Moran’s I test statistic for ISGs Ifit1, Ifit3, Rsad2, Irf7, and Isg15 computed for each biological replicate of WT D3 infarcted mice and cell-type deletions of Irf3−/− mice (n = 3 WT mice and n = 2 mice per transgenic line). (f) Data analysed with one-way ANOVA and Dunnett’s post-hoc analysis for multiple comparisons. Data presented as mean values ± s.e.m. and **P < 0.005. Results in (a-f) are representative of 2 independent repeated experiments.

