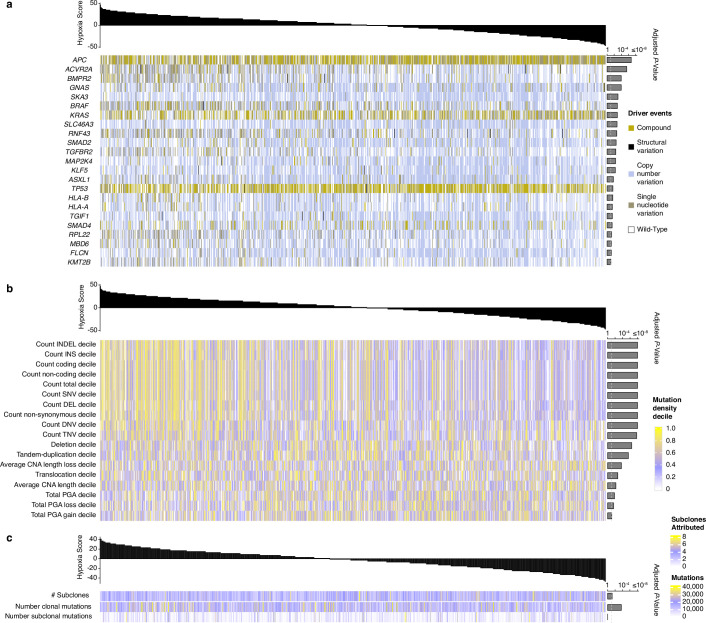
Extended Data Fig. 9. Hypoxia correlation with mutations, structural variants and mutational clonality.
Hypoxia scores based on the Buffa mRNA abundance signature were calculated for all tumours (top) and correlated with (a) mutations in the 96 driver genes, (b) mutation burden and somatic structural variants, and (c) numbers of mutations attributed as clonal and subclonal. Adjusted FDR P-values shown to the right and significance threshold indicated by dotted line (F-test full and null models’ comparison, FDR < 0.05). PGA, percentage of genome with copy number alterations; CNA, copy number alterations; SNV, single nucleotide variation; DNV, double nucleotide variation; TNV, triple nucleotide variation; DEL, deletion; INS, insertion; INDEL, insertion and deletion.

