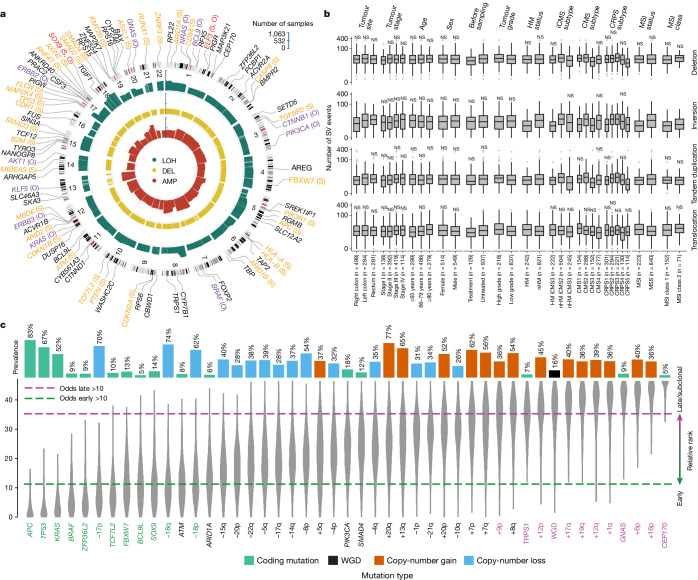
Fig. 2. Structural variation and relative timing of somatic events in CRC.
a, Gene CNVs in driver genes displayed by type: LOH (green), deletion (yellow) and amplification (red). The bar height is proportional to the fraction of tumours with respective alteration. The 91 autosomal driver genes are indicated as oncogenes (O; purple), tumour suppressor genes (S; orange), both (S, O; red) or genes with an unknown role (black), and are displayed by genomic location. b, The SV landscape for deletions, inversions, tandem duplications and translocations displayed by clinical, genomic and transcriptomic features. The boxes represent the interquartile ranges (IQRs) between the first and third quartiles, the centre line represents the median, and the whiskers extend to 1.5× the IQR from the top and bottom of the box. Statistical analysis was performed using two-sided Wilcoxon rank-sum tests; *FDR-adjusted P < 0.05, **FDR-adjusted P < 0.01, ***FDR-adjusted P < 0.001, ****FDR-adjusted P < 0.0001. c, The prevalence and relative timing of driver gene mutations and SVs in 801 nHM CRC tumours by PhylogicNDT. Early/clonal (green), intermediate (black) and late/subclonal (purple) alterations are indicated. WGD, whole-genome duplication.

