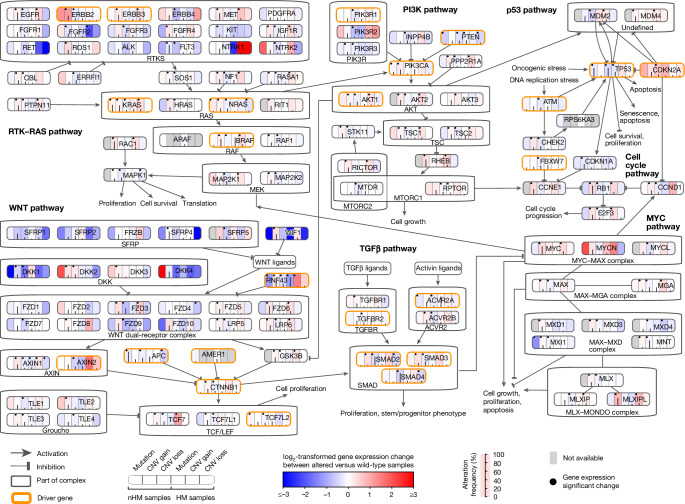
Fig. 3. Integrative analysis of somatic alterations and gene expression levels in CRC signalling pathways.
The frequencies of somatic alterations, including mutations and copy-number (CNV) loss and gain for each gene in nHM and HM tumours. Red (log2[fold change (FC)] > 0) and blue (log2[FC] < 0) colour intensities represent the log-transformed FC between mutated and wild-type tumours by type of somatic alteration (mutation, CNV gain and CNV loss for nHM and HM samples). Somatic alteration frequencies are indicated by the black line in each column. Black dots show gene expression changes with FDR-adjusted P < 0.05 (two-sided Wilcoxon rank-sum test). Driver genes are marked by orange borders.

