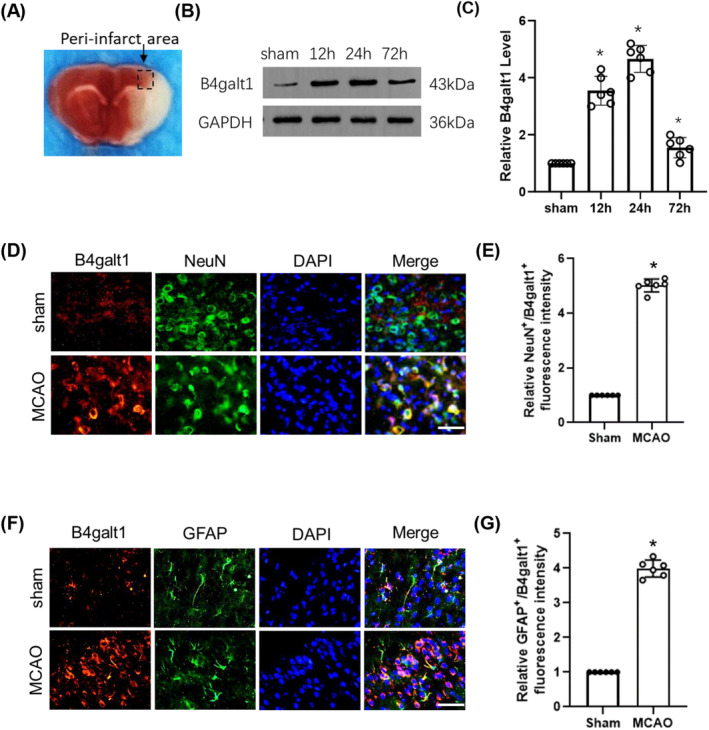
FIGURE 1.

The levels of B4galt1 at 12 h, 24 h, 72 h after I/R. (A) Representative image of the peri‐infarct penumbra. (B) Representative pictures of Western blotting data in the peri‐infarct penumbra of mice. (C) Quantitative analysis of the protein level of B4galt1. (D, F) Representative double immunostaining of B4galt1 (red) with NeuN (a neuronal marker, green) and GFAP (an astrocyte glial marker, green) from ischemic penumbra of brain tissue after MCAO surgery. (E, G) Quantification of NeuN+/B4galt1+ and GFAP+/B4galt1+ fluorescence intensity was quantified using ImageJ. Scale bars, 50 μm. *p < 0.05 versus Sham group. Data are expressed as mean ± SD, n = 6 for each group.
