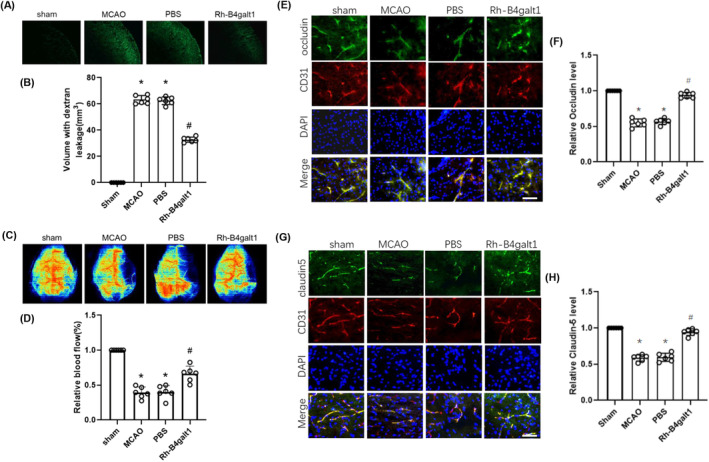
FIGURE 3.

Rh‐B4galt1 reduced BBB leakage after I/R injury. (A) Brain slices showing FITC‐dextran leakage. (B) Quantitative analysis of FITC‐dextran content in ischemic hemisphere. (C) Laser speckle imaging at 24 h after reperfusion. (D) Quantification of relative blood flow. (E) Co‐staining of occludin (green), CD31 (an endothelial cell marker, red) and DAPI (blue) in the penumbra. (F) Quantitative analysis of occludin. (G) Co‐staining of claudin‐5 (green), CD31 (red) and DAPI (blue) in the penumbra. (H) Quantitative analysis of claudin‐5. Scale bar: 50 μm. *p < 0.05 versus Sham group; # p < 0.05 versus MCAO group. Data are expressed as mean ± SD, n = 6 for each group.
