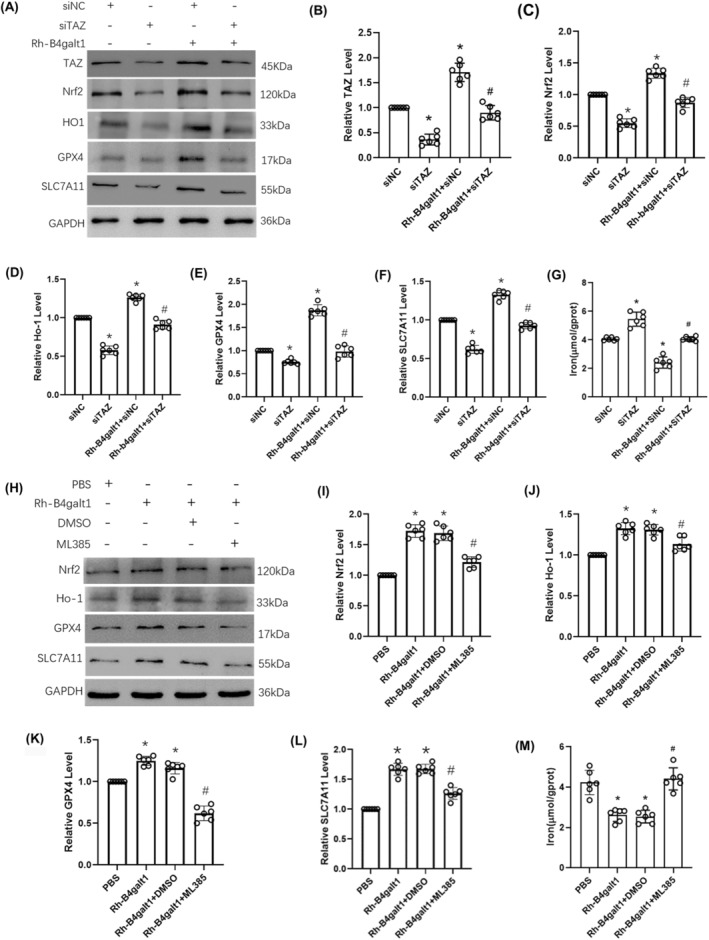
FIGURE 6.

The effects of rh‐B4galt1 on ferroptosis via the TAZ/Nrf2/HO‐1 signaling pathway. (A–F) Representative Western blotting images and quantitative analysis of the levels of TAZ, Nrf2, HO‐1, GPX4 and SLC7A11. (G) The iron concentration in the brain tissue. *p < 0.05 versus siNC group; # p < 0.05 versus Rh‐B4galt1+siNC group. (H–L) Western blotting was carried out to test the expression of Nrf2, HO‐1, GPX4, and SLC7A11. (M) The iron concentration in the brain tissue. *p < 0.05 versus PBS group; # p < 0.05 versus Rh‐B4galt1 group. Data are expressed as mean ± SD, n = 6 for each group.
