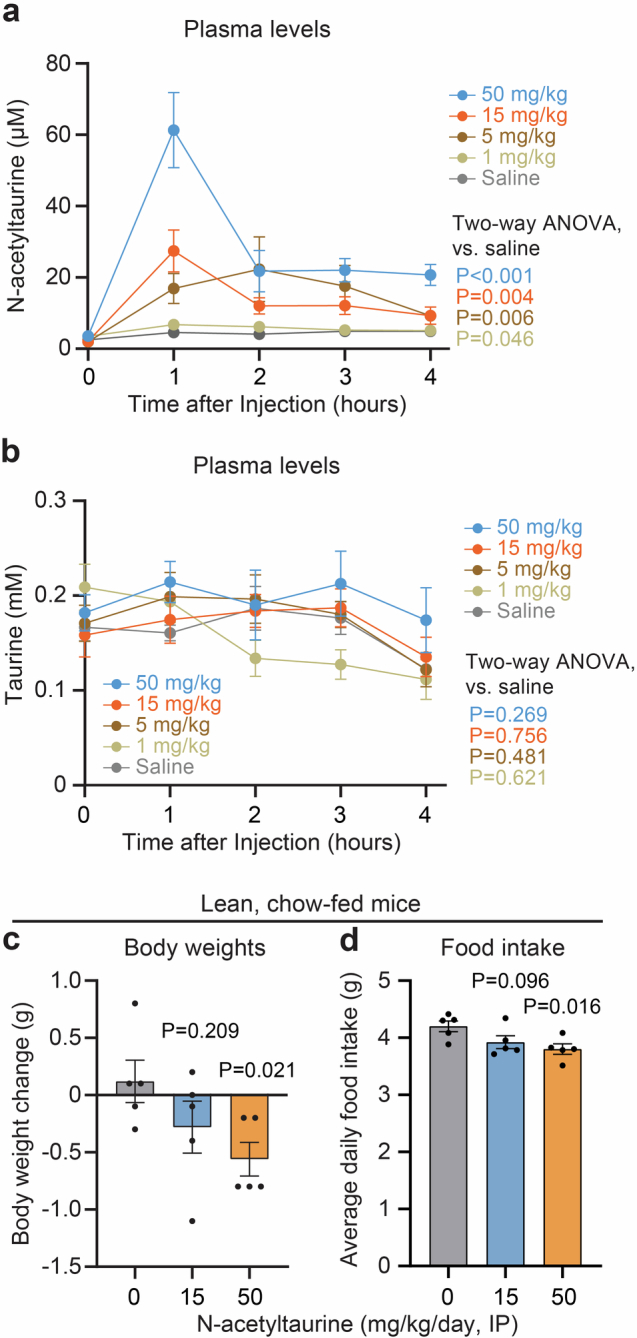
Extended Data Fig. 6. Additional characterization of N-acetyltaurine administration to wild-type mice.

Related to Fig. 5. a,b, Blood plasma concentrations of N-acetyltaurine (a) or taurine (b) from 26- to 28-week-old male DIO C57BL/6J mice after intraperitoneal injection with indicated doses of N-acetyltaurine. For saline versus N-acetyltaurine (50 mg/kg), P = 2e-04. N = 5/group. c,d, Body weight change (c) and food intake (d) of 13-week-old chow-fed male C57BL/6J mice following 7 days of treatment with the indicated dose of N-acetyltaurine (intraperitoneal injection). N = 5/group. Data are shown as mean ± SEM. In c,d, P-values were calculated from two-tailed unpaired t-tests. In a,b, P-values were calculated from two-way ANOVA with post hoc Sidak’s multiple comparisons test.
