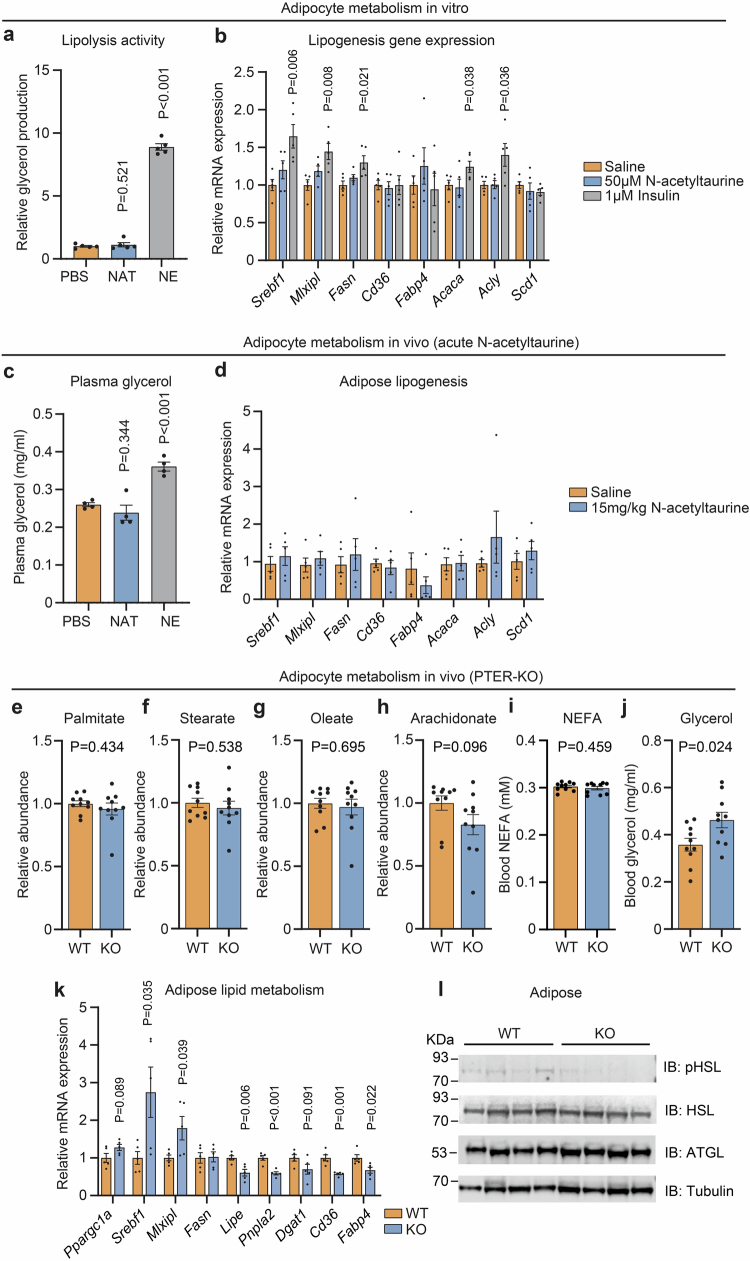
Extended Data Fig. 9. Direct and indirect effects of N-acetyltaurine on adipose.
Related to Fig. 5. a, Glycerol production from mature epididymal adipocytes isolated from 4-month-old male C57BL/6J mice after incubation with 50 μM N-acetyltaurine (NAT) or 1 μM norepinephrine (NE) at 37 °C for 1 h. For PBS versus NE, P = 1.72e-09. N = 5/group. b, mRNA expression of indicated genes from mature epididymal adipocytes isolated from 4-month-old male C57BL/6J mice and incubated with PBS or 50 μM N-acetyltaurine or 1 μM insulin at 37 °C for 4 h with constant shaking. N = 5/group. c, Plasma glycerol levels of 4-month-old male DIO C57BL/6J mice one hour after a single administration of N-acetyltaurine (NAT, 15 mg/kg, IP) or norepinephrine (NE, 0.5 mg/kg, IP) treatment. For PBS versus NE, P = 2.33e-04. N = 4/group. d, mRNA expression of indicated genes from epididymal white adipose tissues of 4-month-old male DIO C57BL/6J mice four hours after a single administration of N-acetyltaurine (15 mg/kg, IP) treatment. N = 5/group. e-j, Plasma palmitate (e), stearate (f), oleate (g), arachidonate (h), total non-esterified fatty acids (i), and glycerol (j), mRNA expression of indicated genes from epididymal white adipose tissue (k), Western blotting of epididymal white adipose tissues with the indicated antibodies (l) of 13 to 14-week-old male WT or PTER-KO mice after 8 weeks on high fat diet and taurine water supplementation (2.5% w/v). For WT versus PTER-KO Pnpla2, P = 6.03e-04. In e-i, N = 10/group. In k, N = 5/group. In l, N = 4/group. Data are shown as mean ± SEM. For l, the loading control was performed on the same blot. In a-j, P-values were calculated from two-tailed unpaired t-tests and were not corrected for multiple comparisons.

