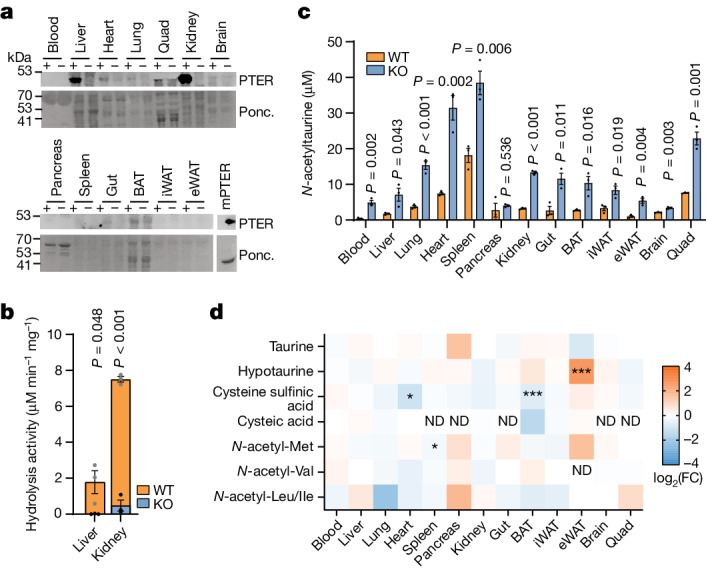
Fig. 3. Biochemical characterization of global Pter KO mice.

a, Anti-PTER blotting (top) and Ponceaus (Ponc.) staining (bottom) of the indicated total tissue lysate from 4-week-old male WT mice and Pter KO mice. Recombinant mouse PTER protein (mPTER; 100 ng) was used as a positive control. b, N-acetyltaurine hydrolysis activity in total lysate from the indicated tissue of WT mice and Pter KO mice (100 µg). Reactions were performed with 100 µM N-acetyltaurine for 1 h at 37 °C. N = 3 per group. For WT versus Pter KO kidney, P = 3.33 × 10⁻⁵. c, Absolute quantification of endogenous N-acetyltaurine levels in the indicated tissue from 4-week-old WT mice and Pter KO mice. N = 3 per group. For WT versus Pter KO lung, P = 6.61 × 10⁻⁴; for kidney, P = 1.12 × 10⁻⁵. d, Relative fold change (FC) of the indicated metabolites from the indicated tissue of 4-week-old WT mice and Pter KO mice. N = 3 per group. In b–d, data are shown as the mean ± s.e.m. For a, the loading control was performed on the same blot. In b–d, P values were calculated from two-tailed unpaired t-tests and not adjusted for multiple comparisons. In d, *P < 0.05, **P < 0.01 and ***P < 0.001. ND, not detected. Experiments were performed twice (a,b) or once (c,d).
