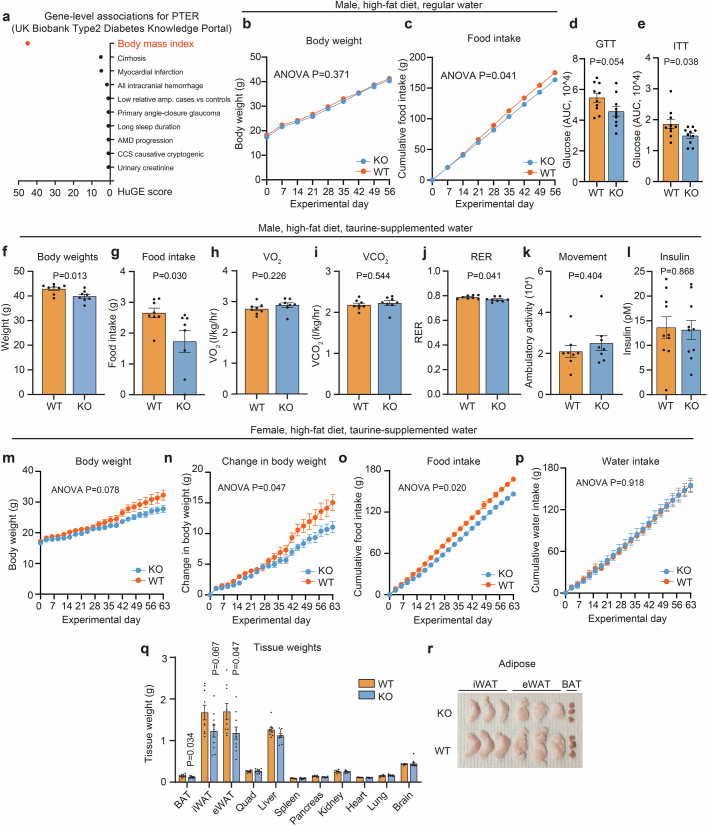
Extended Data Fig. 2. Additional metabolic characterization of male and female PTER-KO mice on high fat diet and taurine-supplemented water.
Related to Fig. 4. a, Human genetic evidence (HuGE) score of phenotype associations for the PTER gene locus from the Type 2 Diabetes Knowledge Portal. b,c, Body weight (b) and food intake (c) of 12- to 13-week-old male PTER-KO mice (N = 10, blue line) or WT mice (N = 14, orange line) subjected to a high-fat diet feeding alone for a period of 8 weeks. d,e, Glucose integrated area under the curve (iAUC) for Fig. 4e,f. f-k, Metabolic chamber analysis of 12- to 13-week-old-male WT or PTER-KO mice after 8 weeks of high fat diet/taurine water supplementation (2.5% w/v). N = 8/group. RER, respiratory exchange ratio. l, Insulin levels of 13 to 14-week-old male WT or PTER-KO mice on high fat diet and after taurine water supplementation (2.5% w/v). N = 10/group. m-r, Body weight (m), change in body weight (n), cumulative food intake (o), and water intake (p), tissue weights (q) and representative adipose tissues (r) of 13- to 14-week-old female WT or PTER-KO mice on high fat diet and after taurine water supplementation (2.5% w/v). N = 10/group. iWAT, inguinal white adipose tissue; eWAT, epididymal white adipose tissue; BAT, brown adipose tissue; Quad, quadricep muscles. Data are shown as mean ± SEM. In b,c and m-p, P-values were calculated from two-way ANOVA with post hoc Sidak’s multiple comparisons test. In d-l and g, P-values were calculated from two-tailed unpaired t-tests and were not corrected for multiple comparisons.

