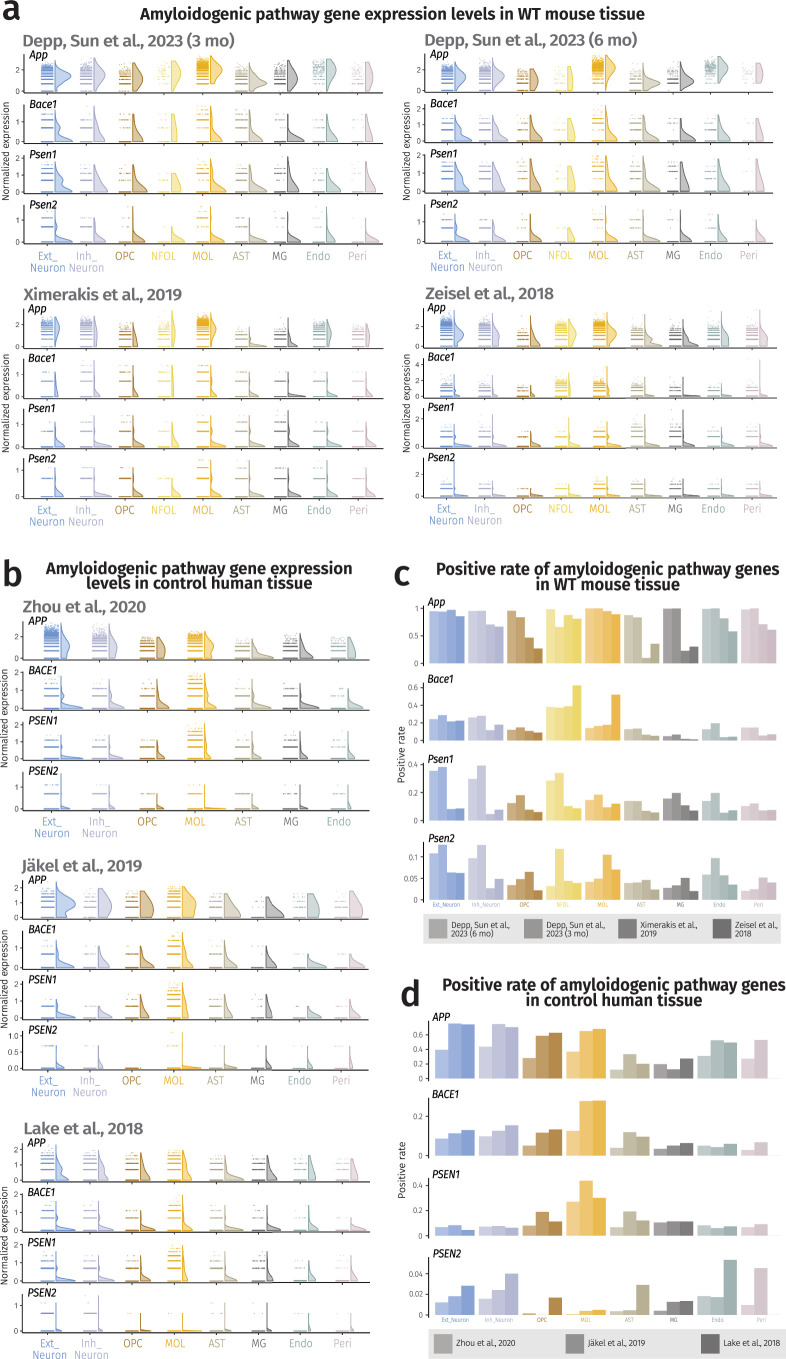
Extended Data Fig. 1. Expression levels and positive rates of amyloidogenic pathway genes across all cell types in the nervous system.
(a) Expression level half violin plots of amyloidogenic pathway genes in all cell types of mouse nervous tissue inputs with SCTransform normalization method from all chosen mouse datasets9,26,27. (b) Expression level half violin plots of amyloidogenic pathway genes in all cell types of human nervous tissue inputs with SCTransform normalization from all chosen human datasets28–30. (a, b) Half violins represent aggregated expression levels of respective genes from each cell type and data points refer to individual expression levels from single cells or nuclei normalized by the SCTransform method. (c) Positive rate barplots of amyloidogenic pathway genes in all cell types of mouse nervous tissue inputs from all chosen mouse datasets9,26,27. (d) Positive rate barplots of amyloidogenic pathway genes in all cell types of human nervous tissue inputs with SCTransform normalization method from all analyzed human datasets28–30. The results published here are based on data obtained from GEO and the AD Knowledge Portal.

