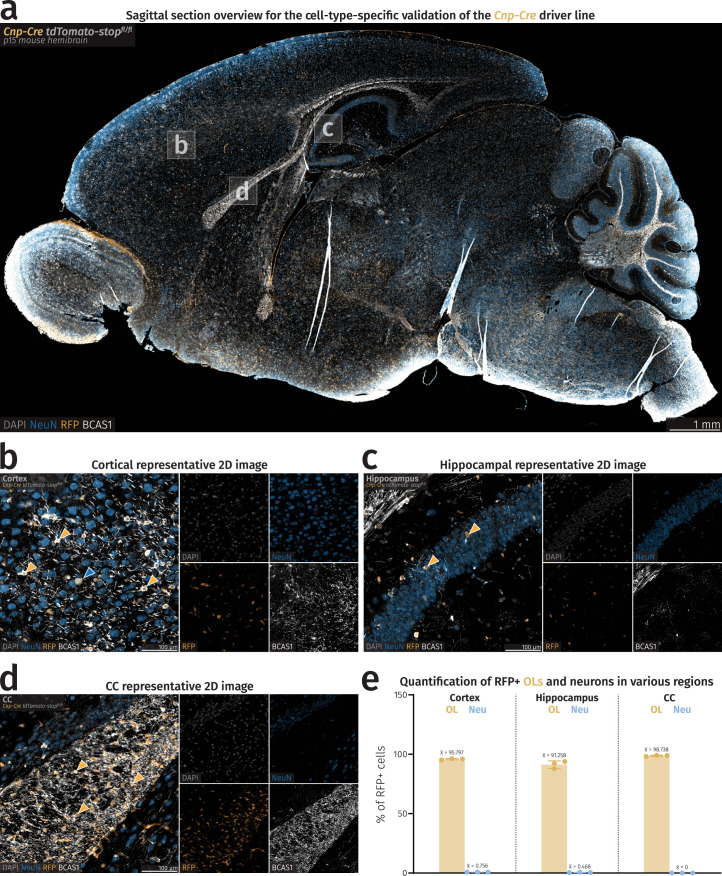
Extended Data Fig. 3. Validation of Cre specificity in Cnp-Cre stop-flox tdTomato mice.
(a) Fluorescence microscopy sagittal overview of a Cnp-Cre stop-flox tdTomato mouse. (b-d) Closeup images of cortex, hippocampus, and CC of a Cnp-Cre stop-flox tdTomato mouse. Yellow arrowheads point to RFP+ OLs and the blue arrowhead points to a single RFP+ neuron in the cortex. (e) Barplots showing percentages of RFP+ OLs and neurons in specific brain regions. Mean percentage values are shown above each bar. Rounded average total number of cells considered for quantification is as follows: Cortex–OLs=283, cortex–neurons=9,232, hippocampus–OLs=66, hippocampus–neurons=3,203, CC–OLs=344, CC–neurons=1.

