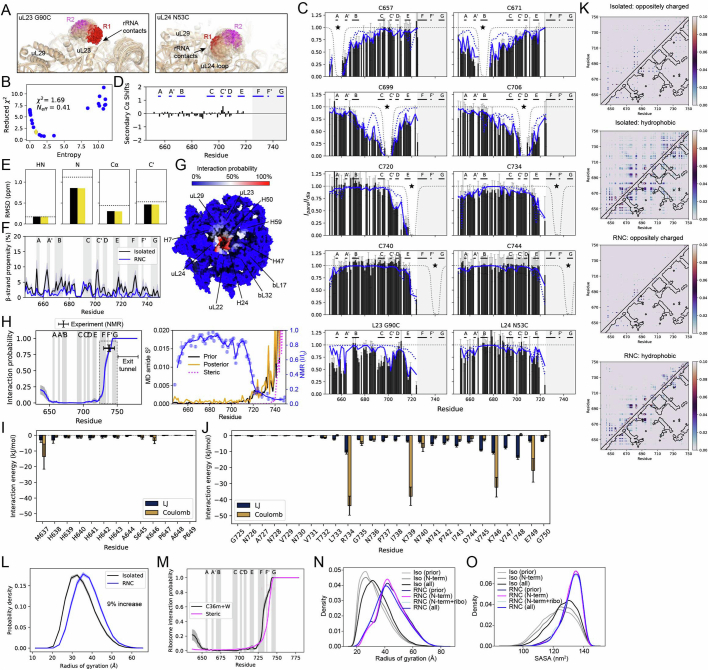
Extended Data Fig. 5. Analysis of unfolded state ensemble on the ribosome obtained from all-atom MD simulations.
(A) Modelling of MTSL rotamer distribution on ribosome labelling sites uL23 G90C and uL24 N53C. Ten E. coli ribosome PDB models (highest resolution models available to date: 4YBB, 6PJ6, 6XZ7, 7K00, 7LVK, 7N1P, 7O1A, 7PJS, 7Z20, 7ZP8) were aligned to the simulation ribosome frame in PyMOL (v2.3). For each ribosome model, MTSL rotamers were fitted to the labelling sites as described in methods. The transparent cloud represents the rotamer cloud from these ten ribosome models, highlighting how small fluctuations in the labelling site can lead to different rotamer distributions. R1 represents the rotamer distribution fitted to the ribosome model utilised in the all-atom MD simulations, while R2 is the rotamer distribution fitted to the ribosome model utilised in our previous work6. We find the RNC ensembles to be in better agreement after reweighting with the R2 rotamer distribution compared to the R1 distribution and used the R2 distribution for the results presented here. (B) Bayesian reweighting of the FLN5 + 31 A3A3 RNC ensemble using the experimental PRE data is shown (see methods). The final χ2 and Neff obtained at the elbow of the curve are shown on the plot. (C) Comparison of back-calculated PREs from MD and the experimental data (black bars, Extended Data Fig. 1) before (dotted blue line) and after reweighting (solid blue line). (D) Secondary Cα chemical shifts of FLN5 + 31 A3A3 measured at 283 K using the POTENCI random coil values139. (E) Average agreement (reported as the RMSD in ppm) between MD (calculated) and experimental chemical shifts before (black) and after (yellow) reweighting with the PRE data. The dotted horizontal line represents the error of the forward model124. (F) β-strand secondary structure propensity (mean ± SEM from block averaging). (G) NC interactions with the ribosome mapped onto the surface of the ribosome. (H) Left: Interactions between the NC and ribosome surface along the protein sequence (mean ± SEM from block averaging). The black cross indicates the experimentally estimated interaction for the C-terminal binding site (within the dotted rectangle) from our previous work7. Right: A comparison of amide S2 order parameters from MD simulations with relative NMR intensities7 further supports the accuracy of NC-ribosome interactions observed in the MD simulations. The decrease in NMR intensities towards the C-terminus around residue 720 coincides with an increase in the amide S2 (restricted dynamics due to ribosome binding). A steric-only model (see methods) does not predict this increase correctly, only showing an increase in the amide S2 around at ~residue 740. (I-J) The residue-specific interaction contributions from Lennard-Jones (LJ) and Coulombic energies (mean ± SEM from block averaging) of the N-terminal (I) and C-terminal (J) ribosome-binding segments are shown. Ribosome interactions are driven by positively charged C-terminal residues (R734, K739, K746) with the rRNA and E749 interacting with RNA-bound Mg2+ ions and K47 within the uL24 loop. (K) Analysis of intramolecular contacts within FLN5 A3A3 on and off the ribosome between different types of residues (oppositely charged and hydrophobic). (L-M) Probability distributions of the FLN5 A3A3 steric-only model on and off the ribosome and comparison between the steric-only model and C36m+W ensemble of the NC-ribosome interaction probability along the FLN5 sequence (mean ± SEM from block averaging). (N) Rg and (O) SASA probability distributions for isolated and RNC FLN5 A3A3 before reweighting (prior) and after reweighting with different datasets (see Supplementary Tables 2–4).

