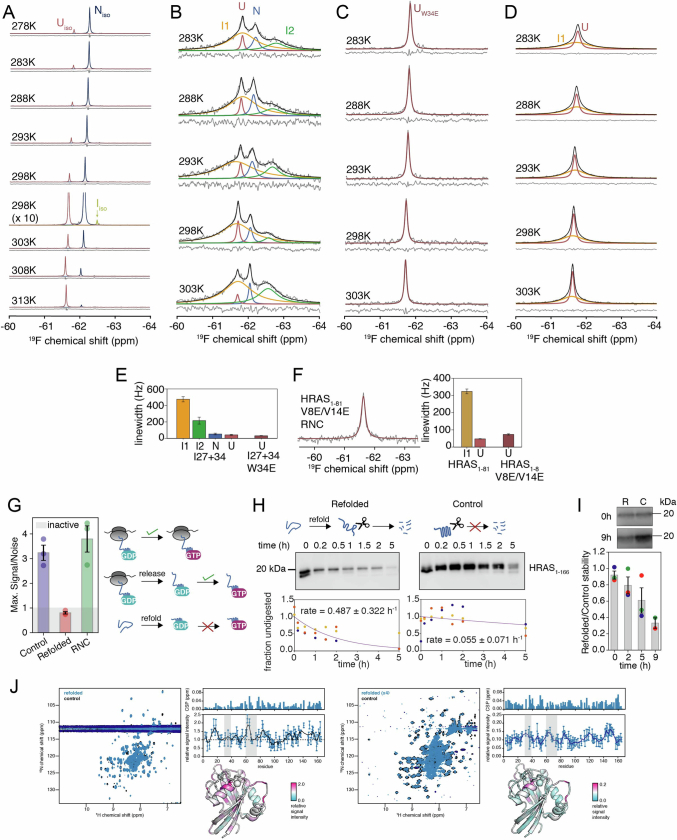
Extended Data Fig. 9. Co- and post-translational folding thermodynamics of I27 and HRAS.
(A) 19F NMR spectra of isolated titin I27 (F73A variant), (B) titin I27 + 34 RNC, (C) titin I27 + 34 W34E RNC (a fully unfolded variant37) and (D) HRAS1-81 on the ribosome recorded at different temperatures (at a 19F-Larmor frequency of 470 MHz). (E) The linewidths of all four states in the wild-type and unfolded state of the mutant I27 + 34 RNC are shown as the mean ± SEM from fitted NMR lineshapes. (F) 19F NMR spectrum of HRAS1-81 on the ribosome with two destabilising mutations V8E/V14E recorded at 298 K and a 19F-Larmor frequency of 470 MHz. Analysis of the NMR data in the time domain (as described in ref. 6) shows that the fit is better for a single state compared to two states for the mutant (BIC = 6,897 and BIC = 6,894, respectively). Wild-type HRAS1-81 fits better to two states than a single state (BIC = 17,900 and BIC = 17,721, respectively). The right panel shows the linewidths of the two states in wild-type HRAS1-81 (Fig. 4d) and the mutant shown here. The bars represent the mean ± SEM from fitted NMR lineshapes. (G) HRAS GDP/GTP nucleotide exchange assay (schematic on top shows exchange from GDP- to GTP-bound state for RNC, released (control) and refolded HRAS). The plot shows the GDP/GTP exchange activity (mean ± SEM) from three independent refolding reactions (n = 3). We measured the activity as the maximum signal/noise fluorescence ratio obtained relative to buffer (see Methods). Values of ≤ 1 signify no activity. (H) Pulse proteolysis experiments of refolded and native (control) HRAS. The proteolytic stability of HRAS was assayed with thermolysin (see schematic on top). Exemplar western blots are shown and densitometry analyses from three independent refolding repeats (n = 3) are globally fit to an exponential decay with the obtained degradation rate indicated on the plot (mean ± SD from fitted parameters are shown). See Supplementary Fig. 6 for uncropped gel images. (I) Pulse proteolysis experiments (with thermolysin) of refolded (R) and native (control, C) HRAS in rabbit reticulocyte lysate (RRL). Exemplar western blots are shown comparing relative refolded/GDP band intensities at 0 and 9 h time points. Densitometry analyses (mean ± SEM) with n = 3 for the 0, 2 and 5 h time points and n = 2 refolding reactions for the 9 h time point are shown in the bottom bar plot. See Supplementary Fig. 7 for uncropped gel images. (J) 1H-15N SOFAST-HMQC NMR spectra of refolded and native (control) HRAS for two independent refolding reactions (left and right, recorded at 298 K and 700 and 800 MHz, respectively). The chemical shift perturbations (CSPs) and signal intensities (mean ± RMSE obtained from spectral noise) of refolded relative to native HRAS are shown below the spectra. The shaded grey areas highlight switch regions 1 and 2, respectively, and the relative signal intensities are also coloured on the HRAS structure (PDB 4Q21).

