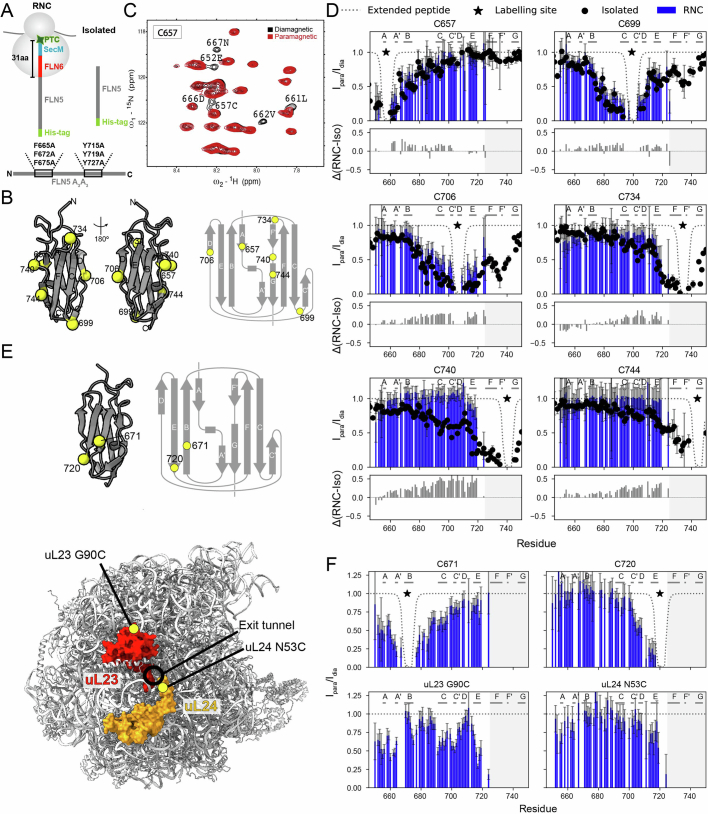
Extended Data Fig. 1. PRE analysis of unfolded FLN5 on and off the ribosome.
(A) Schematics of the constructs used for the PRE experiments. The RNC is comprised of an N-terminal His-tag (for purification), FLN5 A3A3, the subsequent domain FLN6, and an enhanced version of the SecM-AE1 stalling sequence6,7. The FLN5 A3A3 mutant was previously described7. (B) (Left) The annotated crystal structure (PDB 1QFH93) is shown from two views towards the two main β-sheets, highlighting the PRE labelling sites used for both the isolated protein and the RNC. (Right) The secondary structure of folded FLN5 and labelling sites are shown. (C) Region of an exemplar 1H-15N HMQC NMR spectrum of isolated FLN5 A3A3 spin-labelled at C657 (see Supplementary Fig. 1 for full spectrum). The paramagnetic and diamagnetic spectrum are overlayed. (D) PRE intensity ratio profiles for six different labelling sites (indicated with the black star) on (blue) and off (black) the ribosome. NMR data were recorded at 800 MHz, 283 K. Theoretical reference profiles expected for a fully extended polypeptide are also shown as dashed lines (see methods). The secondary structure elements (β-strands) of native FLN5 are indicated at the top. The shaded region at the C-terminus represents the region of FLN5 that is broadening beyond detection through ribosome interactions (N730-K746, in the RNC)7. The second panel with grey bars under each dataset shows the difference between the RNC and isolated data. (E) (Top) The annotated crystal structure (PDB 1QFH93) of FLN5 is shown with two additional labelling sites used for the RNC construct. (Bottom) Annotated MTSL labelling sites (yellow circles) on the ribosome structure near the exit tunnel. (F) PRE intensity ratio profiles for the two addition labelling sites within FLN5 A3A3 and two ribosomal MTSL labelling sites recorded at 800 MHz, 283 K. All data show the fitted mean NMR intensities ± RMSE propagated from spectral noise. See Supplementary Fig. 1 for NMR spectra.

