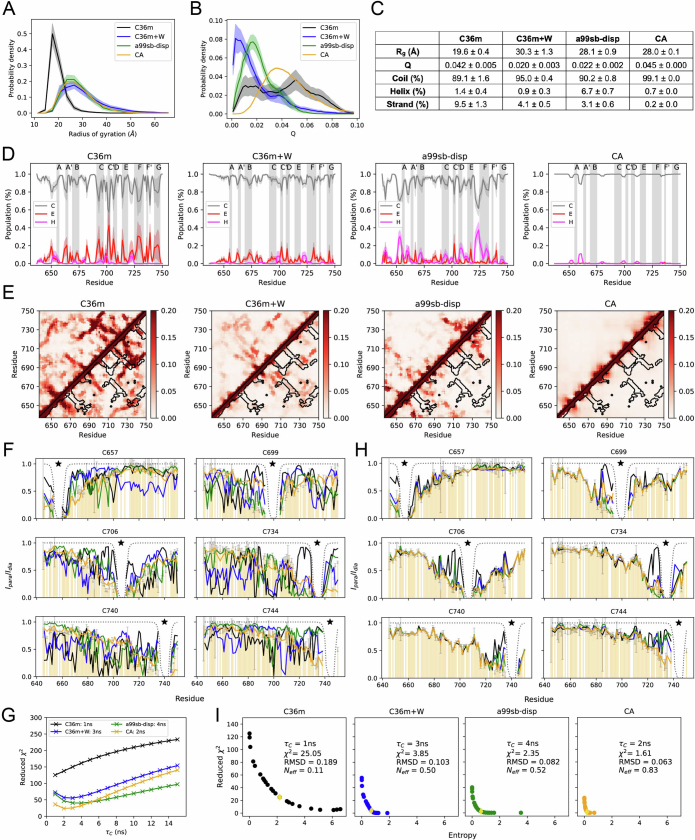
Extended Data Fig. 3. Analysis and reweighting of MD simulations for isolated FLN5 A3A3.
(A) Probability distributions of the all-atom radius of gyration (Rg) for the different ensembles (mean ± SEM from block averaging). (B) Probability distributions of the fraction of native contacts (Q, relative to natively folded FLN5, mean ± SEM from block averaging). (C) Ensemble-averaged properties including Rg, Q and secondary structure populations are summarised (mean ± SEM from block averaging). (D) Average secondary structure propensities (mean ± SEM from block averaging) along the protein sequence determined using the DSSP algorithm (C = coil, E = strand, H = helix)131. The vertical shaded areas highlight the regions of β-strands (annotated as strands A-G) in natively folded FLN5. (E) Average contact maps of the ensembles (zoomed in to a probability of 0.2 for clarity). Contacts were defined as Cα- Cα distances of less than 10 Å. The black contours highlight the native contact map of folded FLN5. Above and below the diagonal are identical. (F) Overlay of experimental data (shown in transparent orange bars) with the calculated PREs of the four ensemble before and after (H) reweighting. Colours are as in panels A-B. (G) Determination of optimal τC for each ensemble by computing the reduced χ2 statistic against the experimental PRE-NMR data (Extended Data Fig. 1). Values of τC were scanned in steps of 1 ns from 1 to 15 ns and the optimal value found is displayed in the figure legend. Colours are as in panels A-B. (I) L-curve analysis to identify an optimal balance between the prior ensemble and agreement with experimental data117. The entropy term on the x-axis represents the Kullback-Leibler divergence and quantifies the extent of deviation from the prior ensemble. The optimal value of τc as determined from the prior ensemble as well as the χ2, RMSD and Neff (fraction of effective frames contributing to the ensemble average calculated as ln(-Entropy)119) are displayed in each panel for the corresponding elbow of the L-curve, which is the final solution chosen from the reweighting analysis (see methods).

