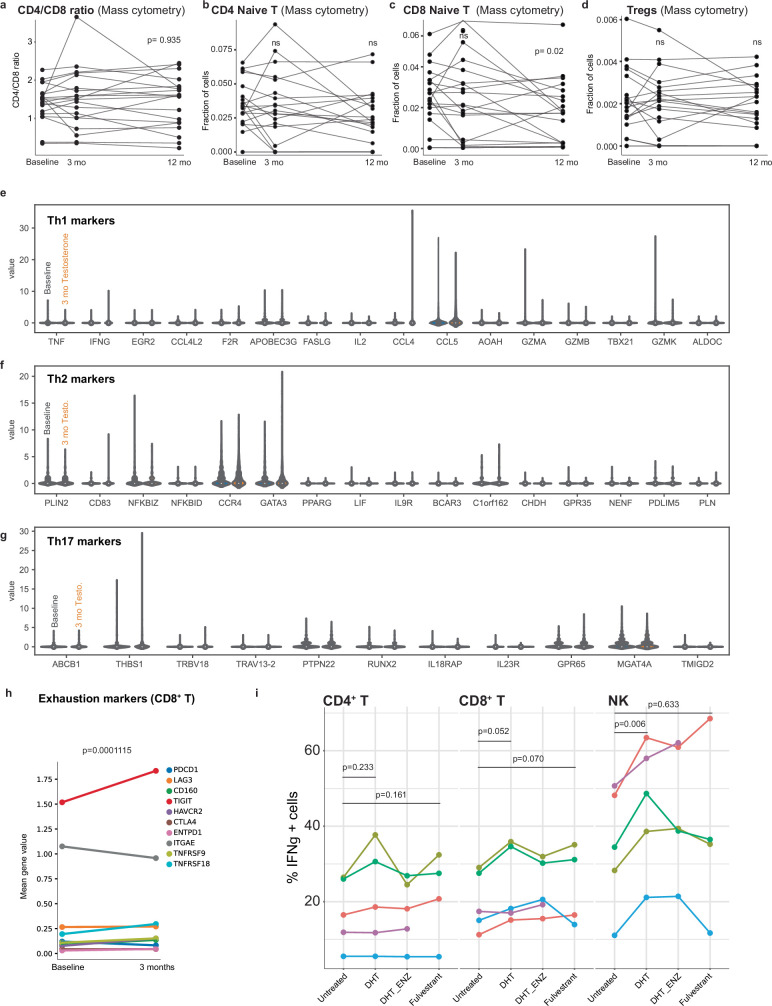
Extended Data Fig. 5. T cell adaptation to testosterone treatment.
a) CD4/CD8 ratio, b) Naive CD4 + T cells, and c) Naive CD8 + T cell fractions before and during testosterone treatment. P-values from two-sided, paired and uncorrected t-tests. n.s = non-significant. d) Mass cytometry analyses of Treg frequency. P-values from two-sided, paired and uncorrected t-tests. n.s = non-significant. e) Single cell mRNA sequencing from PBMCs at baseline and after 3 months of testosterone in vivo selected on memory CD4 + T cells and transcripts related to Th1, f) Th2 and g) Th17 markers shown. h) Expression of the indicated T cell exhaustion markers for CD8 + T cells at baseline and 3 months following testosterone analyzed by single cell mRNA sequencing. P-value from 2-sided, uncorrected t-test indicating global module expression at baseline vs. 3 months. i) Five healthy female donors, pretreated with DHT, DHT + AR inhib. (Enzalutamide) or ESR inhibitor (Fulvestrant) followed by PMA/Ionomycin stimulation (4 h) and analyzed by intracellular IFNγ in CD4+ T, CD8+ T and NK cells analyzed by repeated measures ANOVA with Tukey’s Honest Significant Differences posthoc multiple hypothesis test.

