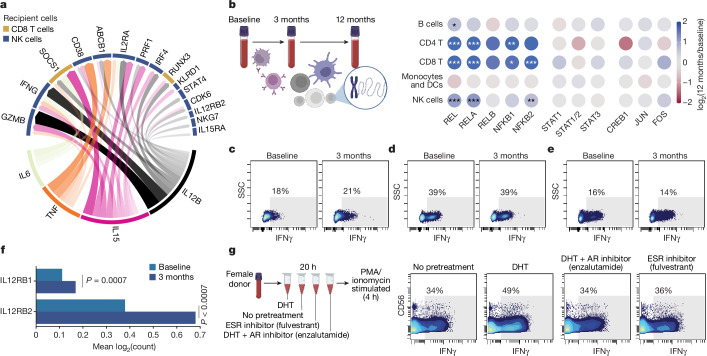
Fig. 4. NFkB activation and IFNγ induction in NK cells following testosterone therapy.
a, NicheNet analysis of monocytes from single-cell transcriptome data of LPS-stimulated PBMC comparing 3 months of in vivo testosterone treatment versus baseline. All target genes (top half of circle) are upregulated after testosterone treatment in vivo in NK cells and CD8+ T cells. Most explanatory genes in monocytes are shown in the lower half of the circle. Arrow width and density correspond to strength of inferred relationship. b, Blood T cells analysed for TF binding site chromatin accessibility as log-fold enrichment at 12 months versus baseline for a given TF with indicated cell populations using sc-ATAC-sequencing of PBMC (n = 12,773) from three participants sampled before and during testosterone treatment. Cells were assigned to indicated cell populations on the basis of gene activity for canonical marker genes. Adjusted P values: *P < 0.05, **P < 0.01, ***P < 0.001. c–e, PBMCs obtained at baseline or after 3 months of testosterone treatment were simulated with PMA/ionomycin for 4 h in vitro and intracellular IFNγ production in NK cells (c), CD8+ T cells (d) and CD4+ T cells (e) was analysed using flow cytometry. Numbers indicate percentage IFNγ+ cells. f, Expression of IL12RB1 and IL12RB2 mRNA in NK cells at baseline and after 3 months of in vivo testosterone treatment by sc-mRNA-seq. Two-sided, independent samples and uncorrected Student’s t-test; ***P < 0.001. g, Blood from one healthy cisgender female participant was incubated for 20 h with DHT with/without Enzalutamide or Fulvestrant followed by stimulation with PMA/ionomycin for 4 h, staining for intracellular cytokines and analysis by mass cytometry. Manually gated NK cells are shown and the fraction of IFNγ+ cells was determined on the basis of staining controls as indicated.

