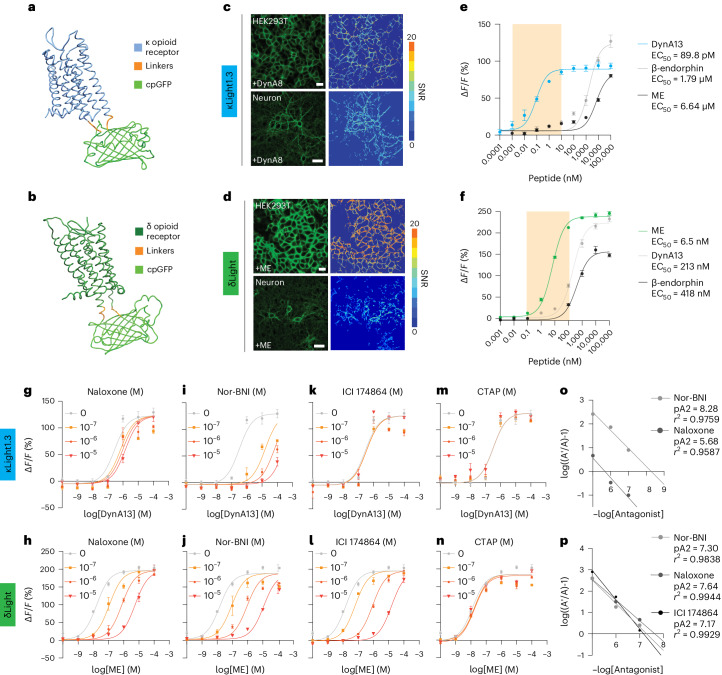
Fig. 1. Development of the opioid sensors.
a,b, Simulated structure of κLight (a) and δLight (b). c,d, Representative images of four independent transient transfections of κLight1.3 (c) and δLight (d) in HEK293T cells and cultured hippocampal neurons. Heat map indicates SNR upon addition of DynA8 (100 μM) or ME (100 μM). Scale bar, 20 μm (cells) and 50 μm (neurons). e,f, In situ titration of κLight1.3 (e) and δLight (f)-expressing HEK293T cells respond to ligands in a concentration-dependent manner (DynA13, blue; β-endorphin, gray; ME, black). Error bars represent the s.e.m. The highlighted area corresponds to a concentration range from 1 pM to 10 nM or 100 pM to 100 nM. Dyn, dynorphin. g,h, Schild plot of κLight1.3 (g) and δLight (h) dose response with 100 nM, 1 μM and 10 μM of naloxone. i,j, Schild plot of κLight1.3 (i) and δLight (j) dose response with 100 nM, 1 μM and 10 μM of Nor-BNI. k,l, Schild plot of κLight1.3 (k) and δLight (l) dose response with 100 nM, 1 μM and 10 μM of ICI 174864. m,n, Schild plot of κLight1.3 (m) and δLight (n) dose response with 100 nM, 1 μM and 10 μM of CTAP. o, Combined Schild regression with Nor-BNI and naloxone on κLight1.3. p, Combined Schild regression with Nor-BNI, naloxone and ICI 174864 on δLight. e–o, n = 4. Error bars represent the s.e.m.

