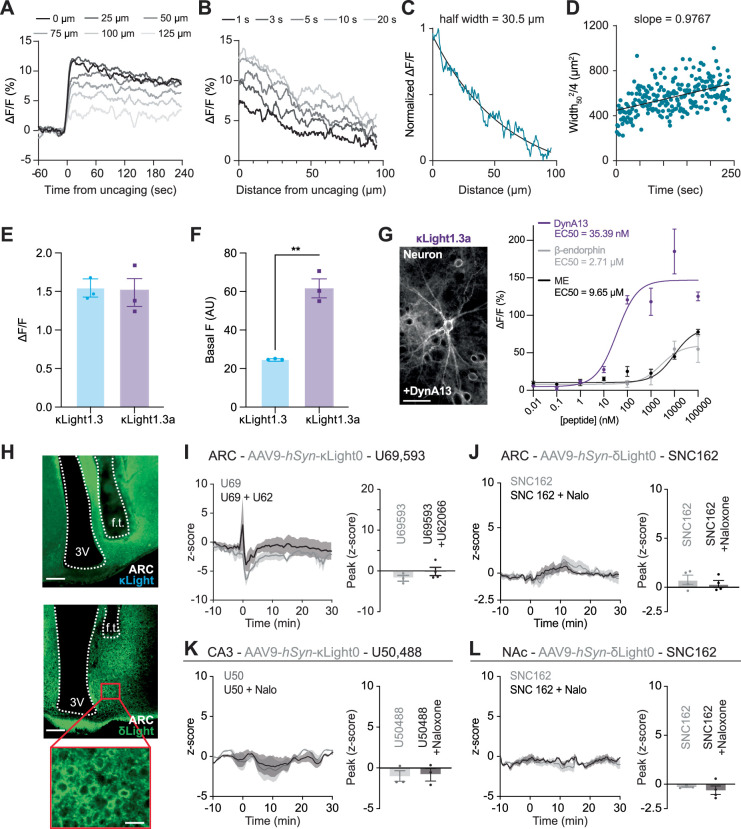
Extended Data Fig. 4. Dynorphin diffusion analysis and in vivo pharmacology with control sensors.
(a) Representative example of the fluorescence response of κLight1.2a for single pixels along the center of the imaging field at various distances from the site of DynA8 photorelease. (b) Representative examples of fluorescence profile as a function of distance from the uncaging site at differing time points after uncaging. (c) Representative example of a fluorescence profile at a single time (5 sec, as in Extended Data Fig. 4b), normalized and fit to an exponential function in order to extract the half width (30.5 µm). (d) Representative plot of the half-width squared/4 vs. time for determination of the apparent diffusion coefficient D*. The fluorescence profile fits (for example Extended Data Fig. 4c) were repeated in 1 second time bins to extract the half-width. The slope of this linear regression is the apparent diffusion coefficient D*. (e) Fluorescence response (ΔF/F) to U50,488 (100 μM) compared between κLight1.3 (blue, n = 3 wells), and κLight1.3a (magenta, n = 3 wells). κLight1.3: 1.56 ± 0.12, κLight1.3a: 1.474 ± 0.18, two tailed unpaired t test, p = 0.724, non-significant. Error bar represents SEM. (f) Basal fluorescence compared between κLight1.3 (blue, n = 3 wells), and κLight1.3a (magenta, n = 3 wells). κLight1.3: 25.0 ± 0.08, κLight1.3a: 61.01 ± 4.49, two tailed unpaired t test, **p = 0.0013. Error bar represents SEM. (g) (Left) representative imaging showing κLight1.3a - expressing dissociated hippocampal neurons, scale bar 50 μm. (Right) κLight1.3a-expressing dissociated hippocampal neurons respond to ligands in a concentration-dependent manner (DynA13 – magenta, β-endorphin – gray, ME – black). Error bars represent SEM. n = 4 wells each. Dyn = dynorphin, ME = met-enkephalin. (h) Representative images showing κLight (top), δLight (middle), and zoomed-in image for δLight (bottom) expression in ARC. Scale bar 150 µm for both κLight and δLight. δLight zoomed insert has scale bar = 30 µm. Abbreviations: ventricle (3 V), fiber track (f.t.). (i) (Left) κLight0 response to 3 mg/kg U69,593 (gray, n = 3 animals), and 3 mg/kg U69,593 + 1 mg/kg U62,066 (black, n = 4 animals) in ARC, Solid lines represent the mean, and shaded areas represent SEM. (Right) bar graph indicating the peak z-score of each response, U69,593: -1.9 ± 0.7 %, U69,593 + U62,066: −0.2 ± 1 %, unpaired t test, p = 0.2625, non-significant. U69 = U69,593, U62 = U62,066. Error bars represent SEM. (j) (Left) δLight0 response to 5 mg/kg SNC162 (gray, n = 4 animals), and 5 mg/kg SNC162 + 4 mg/kg naloxone (black, n = 4 animals) in ARC. Solid lines represent the mean, and shaded areas represent SEM. (Right) bar graph indicating the peak z-score of each response, SNC162: 0.77 ± 0.5 %, SNC162 + naloxone: 0.33 ± 0.4 %, unpaired t test, p = 0.4948, non-significant. Nalo = Naloxone. Error bars represent SEM. (k) (Left) κLight0 response to 10 mg/kg U50,488 (gray, n = 3 animals), and 10 mg/kg U50,488 + 10 mg/kg naloxone (black, n = 3 animals) in CA3. Solid lines represent the mean, and shaded areas represent SEM. (Right) bar graph indicating the peak z-score of each response, U50,488: −1 ± 0.7 %, U50,488 + naloxone: −0.75 ± 0.8 %, two tailed unpaired t test, p = 0.8123, non-significant. U50 = U50,488, Nalo = Naloxone. Error bars represent SEM. (l) (Left) δLight0 response to 5 mg/kg SNC162 (gray, n = 4 animals), and 5 mg/kg SNC162 + 4 mg/kg naloxone (black, n = 3 animals) in ARC, Solid lines represent the mean, and shaded areas represent SEM. (Right) bar graph indicating the peak z-score of each response, SNC162: −0.61 ± 0.4 %, SNC162 + naloxone: −0.27 ± 0.07 %, two tailed unpaired t test, p = 0.5451, non-significant. Nalo = Naloxone. Error bars represent SEM.

