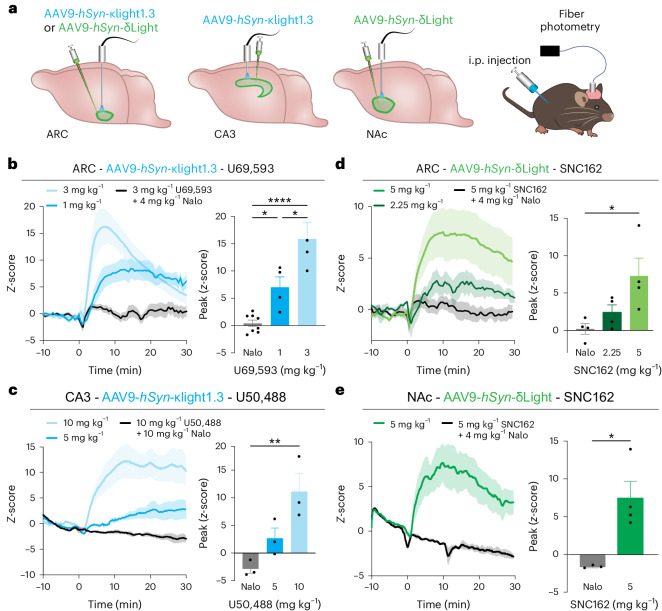
Fig. 4. In vivo drug pharmacology imaged with κLight and δLight.
a, Experimental schematics of κLight1.3 and δLight injection in the hypothalamus (ARC), the hippocampal CA3 and the NAc, followed by imaging with fiber photometry during drug injection. b, κLight1.3 response in ARC to different doses of U69,593, 3 mg per kg body weight (light blue), 1 mg per kg body weight (blue) and 3 mg per kg body weight U69,593 + 4 mg per kg body weight naloxone (black); n = 7 animals. Solid lines represent the mean, and the shaded area represents the s.e.m. Bar graph indicating the peak z-score of each response, 3 mg per kg body weight + naloxone: 0.4% ± 0.6%, 1 mg per kg body weight: 7.0% ± 1.9%, 3 mg per kg body weight: 15.9% ± 3.1%, ordinary one-way ANOVA with Tukey’s multiple-comparisons test, 1 versus 3 *P = 0.012, 1 versus Nalo *P = 0.029, 3 versus Nalo ****P < 0.0001. c, κLight1.3 response to different doses of U50,488 in CA3, 10 mg per kg body weight (light blue), 5 mg per kg body weight (blue) and 10 mg per kg body weight U50,488 + 10 mg per kg body weight naloxone (black) in CA3; n = 3 animals. Solid lines represent the mean, and shaded areas represent the s.e.m. Bar graph indicating the peak z-score of each response, 10 mg per kg body weight + naloxone: −2.9% ± 0.8%, 5 mg per kg body weight: 2.7% ± 1.8%, 10 mg per kg body weight: 11.1% ± 3.2%, ordinary one-way ANOVA with Dunnett’s multiple-comparisons test, **P = 0.0072. d,e, δLight response to different doses of SNC162 in ARC (d) and NAc (e), 5 mg per kg body weight (light green), 2.25 mg per kg body weight (green) and 5 mg per kg body weight SNC162 + 4 mg per kg body weight naloxone (black) in ARC and NAc; n = 4 animals. Solid lines represent the mean, and shaded areas represent the s.e.m. Bar graph indicating the peak z-score of each response; in ARC: 0.2% ± 0.7%, 2.25 mg per kg body weight: 2.4% ± 1.0%, 5 mg per kg body weight: 7.3% ± 2.4%, ordinary one-way ANOVA with Tukey’s multiple-comparisons test, *P = 0.0258; in NAc: 1.7 ± 0.1%, 5 mg per kg body weight: 7.5% ± 2.2%; two-tailed unpaired t-test, *P = 0.0185. In b–e, error bars represent the s.e.m.

