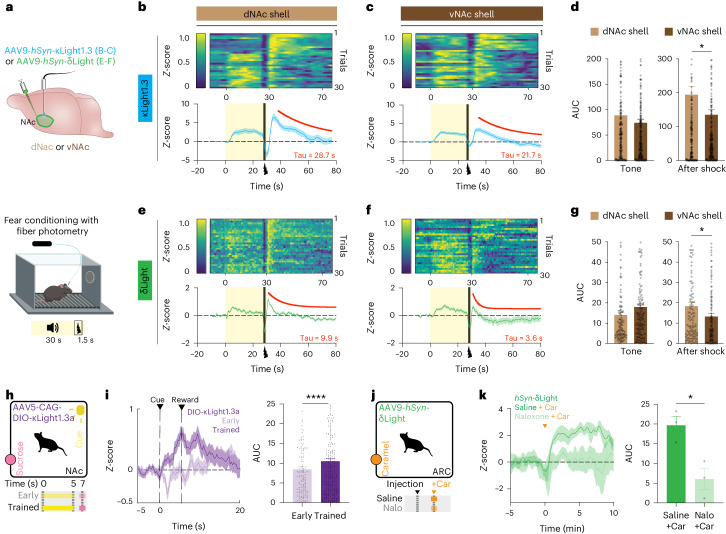
Fig. 6. Imaging dynorphin and enkephalin dynamics during aversive and rewarding behavior.
a, Schematics show expression of κLight1.3 or δLight in the dNAc shell or the vNAc shell (top), followed by a fear conditioning protocol during fiber photometry recording. b,c, κLight1.3 response in the dNAc (b) and the vNAc (c): Top, sorted shock trials averaged across animals from top to bottom in chronological order (trial 1 at the top, trial 30 at the bottom). Bottom, average trace of κLight1.3 response (blue) during fear conditioning, tone (0–30 s, yellow shaded area) and shock (27.5–29 s, black). Solid blue line represents the mean, and the shaded area represents the s.e.m. dNAc, n = 7 animals; vNAc, n = 8 animals. One-phase decay fit from 35 s to 80 s (red). Tau indicates the decay constant. d, AUC of single trials in b and c during tone and after shock. Tone AUC in dNAc: 89 ± 8.5, tone AUC in vNAc: 74 ± 7, two-tailed unpaired t-test, P = 0.1829, NS. Post-shock AUC in dNAc: 194 ± 24, post-shock AUC in vNAc: 135 ± 15, two-tailed unpaired t-test, *P = 0.0355. e,f, δLight response in the dNAc (e) and the vNAc (f). Experimental details same in b and c. dNAc, n = 4 animals; vNAc, n = 5 animals. One-phase decay fit from 31 s to 80 s (red). g, AUC of single trials in e and f during tone and after shock. Tone AUC in the dNAc: 14 ± 1.4, tone AUC in the vNAc: 18 ± 1.5, two-tailed unpaired t-test, P = 0.0582, NS. Post-shock AUC in the dNAc; 18 ± 1.8, post-shock AUC in vNAc; 13 ± 1.4, two-tailed unpaired t-test, *P = 0.0276. Error bars represent the s.e.m. In d and g, all single trial AUCs are plotted and compared for tone (0–25 s) and after shock (30–70 s) from n = 4 animals for δLight response in the dNAc and n = 5 animals for δLight response in the vNAc. h, Schematic shows classical Pavlovian conditioning. i, Left, mean κLight1.3a activity averaged across all trials during day 1 (early; light purple) and day 7 (trained; dark purple) of Pavlovian conditioning (n = 6 animals). Solid lines represent the mean, and shaded areas represent the s.e.m. Right, AUC of single trials across early and trained stages of Pavlovian conditioning; early: 8.4 ± 0.74, trained: 10.51 ± 0.77, two-tailed paired t-test, ****P < 0.0001. Error bars represent the s.e.m. j, Schematic shows caramel retrieval experiment. k, Left, averaged δLight activity upon caramel retrieval after injection of saline (dark green) or 4 mg per kg body weight naloxone (light green; n = 3 animals). Solid line represents the mean, and shaded area represent the s.e.m. Right, AUC of single trials compared between saline and naloxone conditions, saline: 20 ± 2.3, naloxone: 6 ± 2.7, *P = 0.0197, two-tailed unpaired t-test. Error bars represent the s.e.m.

