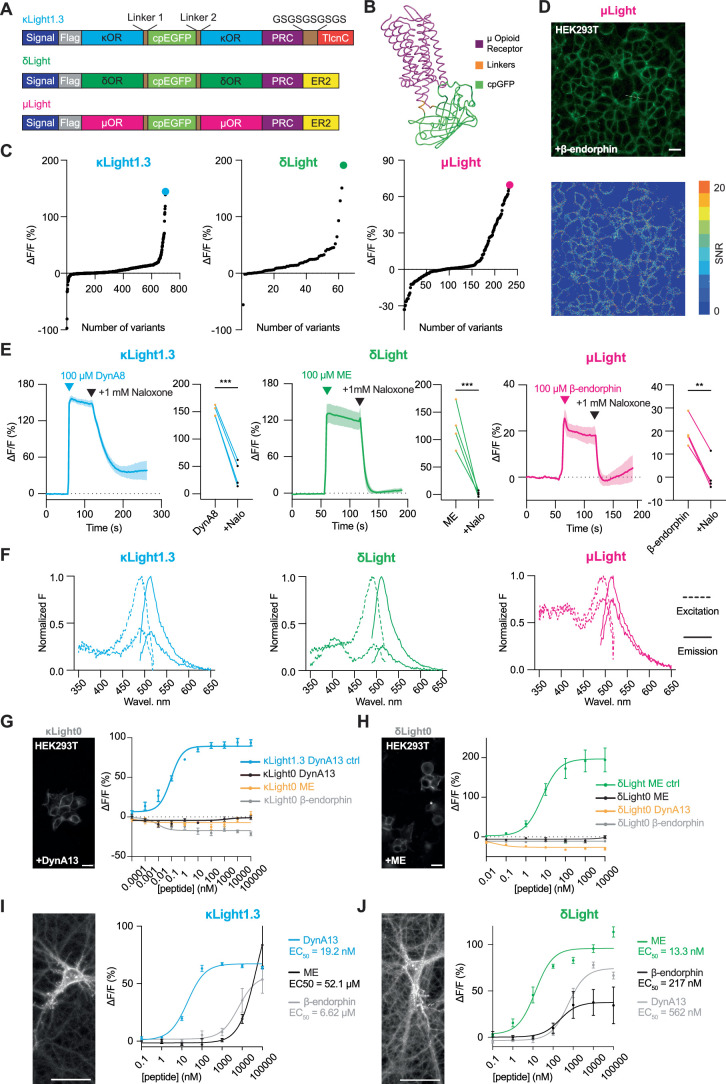
Extended Data Fig. 1. Screening and characterization of the opioid sensors.
(a) Schematic diagrams showing the components of recombinant DNA for each opioid sensor. (b) Simulated structure of µLight. Mu opioid receptor (µOR, magenta), linkers (orange), cpGFP (light green). (c) Optimization of the opioid sensor variants. Dots representing ΔF/F (%) of variants screened along optimizations, including cpGFP insertion sites, linker screening, and point mutations. A ligand concentration of 100 μM was used for screening; U50,488 for κLight (blue), ME for δLight (green) and DAMGO for µLight (magenta). Variants with the highest ΔF/F (%) indicated as κLight1.3 (144.47%) with 698 variants screened; δLight (191%) with 63 variants screened; µLight (69.6%) with 233 variants screened. (d) (Top) Representative image of 4 independent transient transfection of µLight in HEK293T cells. (Bottom) Heatmap indicating signal-to-noise-ration (SNR) upon addition of 100 μM β-endorphin. Scale bar, 20 μm. (e) (Left) Agonist (100 μM DynA8) and antagonist (1 mM naloxone) response of κLight1.3 transiently expressed in dissociated hippocampal neuron cultures. n = 4 wells. Solid blue line represents the mean, and shaded area represents SEM. ΔF/F (%) comparison between two states: agonist response (151 ± 5.0 %), + antagonist response (36.9 ± 11.7 %), two-tailed unpaired t test, ***p = 0.0001. Nalo = Naloxone. (middle) Agonist (100 μM ME) and antagonist (1 mM naloxone) response of δLight transiently expressed in dissociated hippocampal neuron cultures. n = 4 wells. Solid green line represents the mean, and the shaded area represents SEM. ΔF/F (%) comparison between two states: agonist response (123 ± 19.4 %), + antagonist response (1.82 ± 2.4 %), two tailed unpaired t test, ***p = 0.0008. (right) Agonist (100 μM β-endorphin) and antagonist (1 mM naloxone) response of µLight transiently expressed in dissociated hippocampal neuron cultures. n = 4 wells. Solid magenta line represents the mean, and the shaded area represents SEM. ΔF/F (%) comparison between two states: agonist response (19.6 ± 3.2 %), + antagonist response (0.75 ± 3.6 %), two tailed unpaired t test, ***p = 0.0082. (Right). (f) Excitation-emission spectra of the three opioid sensors under both bound (upper lines, 100 μM DynA8 for κLight -blue, 100 μM ME for δLight -green, and 100 μM β-endorphin for µLight -magenta) and unbound (lower lines) states. Excitation (dotted lines) of all three sensors peaks at ~490 nm, and emission (solid lines) of all three sensors peaks at ~515 nm. (g) (Left) representative imaging showing κLight0-expressing HEK293T cells, scale bar 20 μm. (Right) κLight0-expressing HEK293T cells respond to ligands in a concentration-dependent manner plotted together with κLight1.3 (DynA13-κLight1.3 – blue, DynA13-κLight0 – black, β-endorphin-κLight0 – gray, ME-κLight0 – yellow). Error bars represent SEM. n = 4 wells each. Dyn = dynorphin, ME = met-enkephalin. (h) (Left) representative imaging showing δLight0-expressing HEK293T cells, scale bar 20 μm. (Right) δLight0-expressing HEK293T cells respond to ligands in a concentration-dependent manner plotted together with δLight (ME-δLight – green, ME-δLight0 – black, β-endorphin- δLight0 – gray, DynA13- δLight0 – yellow). Error bars represent SEM. n = 4 wells each. Dyn = dynorphin, ME = met-enkephalin. (I) (Left) representative imaging showing κLight1.3 - expressing dissociated hippocampal neurons, scale bar 50 μm. (Right) κLight1.3-expressing dissociated hippocampal neurons respond to ligands in a concentration-dependent manner (DynA13 – blue, β-endorphin – gray, ME – black). Error bars represent SEM. n = 4 wells each. Dyn = dynorphin, ME = met-enkephalin. (j) (Left) representative imaging showing δLight - expressing dissociated hippocampal neurons, scale bar 50 μm. (Right) δLight-expressing dissociated hippocampal neurons respond to ligands in a concentration-dependent manner (ME – green, DynA13 – gray, β-endorphin – black). Error bars represent SEM. n = 4 wells each. Dyn = dynorphin, ME = met-enkephalin, scale bar, 50 μm.

