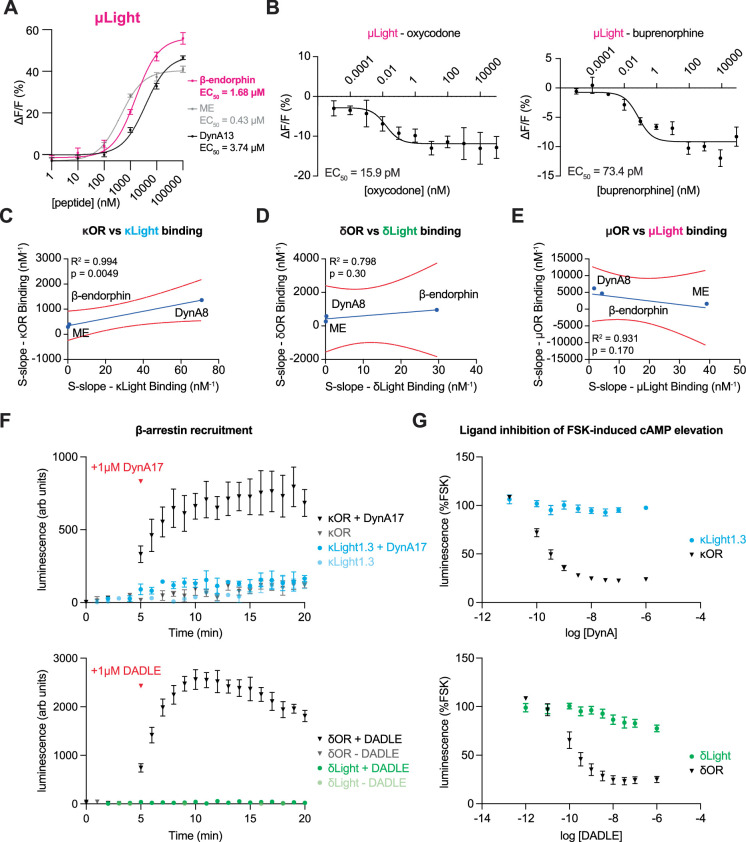
Extended Data Fig. 2. Binding studies of selected compounds on the opioid sensors and receptors.
(a) Concentration-response curves of µLight-expressing HEK293T cells to three peptide ligands (β-endorphin – magenta, ME – gray, DynA13 – black). Error bars represent SEM. (b) Concentration-response curve of µLight-expressing HEK293T cells to oxycodone and buprenorphine. Error bars represent SEM. (c) Linear regression plot between the s-slope (maximum displacement / IC50, in nM-1) for κOR (S-slope - κOR Binding) and κLight1.3 (S-slope - κLight Binding) measured with a radio-ligand binding assay. Red curves indicate 95 % confidence interval. (d) Linear regression plot between the s-slope (maximum displacement / IC50, in nM-1) for δOR (S-slope - δOR Binding) and δLight (S-slope - δLight Binding) measured from radio-ligand binding assay. Red curves indicate 95 % confidence interval. (e) Linear regression plot between the s-slope (maximum displacement / IC50, in nM-1) for µOR (S-slope - µOR Binding) and µLight (S-slope - µLight Binding) measured from radio-ligand binding assay. Red curves indicate 95 % confidence interval. (f) NanoBiT assay (κOR / κLight1.3 or δOR / δLight + SmBiT-βarr1 + LgBiT-CAAX) measuring βarrestin1 translocation to plasma membrane upon stimulation with 1 µM DynA17 (top: κOR + DynA17 (black), κOR (gray), κLight1.3 + DynA17 (blue), κLight1.3 (light blue), 1 µM DynA17 added at 5 min) or 1 µM DADLE (bottom: δOR + DADLE (black), δOR (gray), δLight + DADLE (green), δLight (light green), 1 µM DADLE added at 5 min), n = 3 for each experiment, error bars represent SEM. (g) GloSensor cAMP assay measuring DynA17 inhibition of forskolin (FSK)-induced cAMP elevation between top: κOR (black) and κLight1.3 (blue), n = 5, and bottom: δOR (black) and δLight (green), n = 4, error bars represent SEM.

